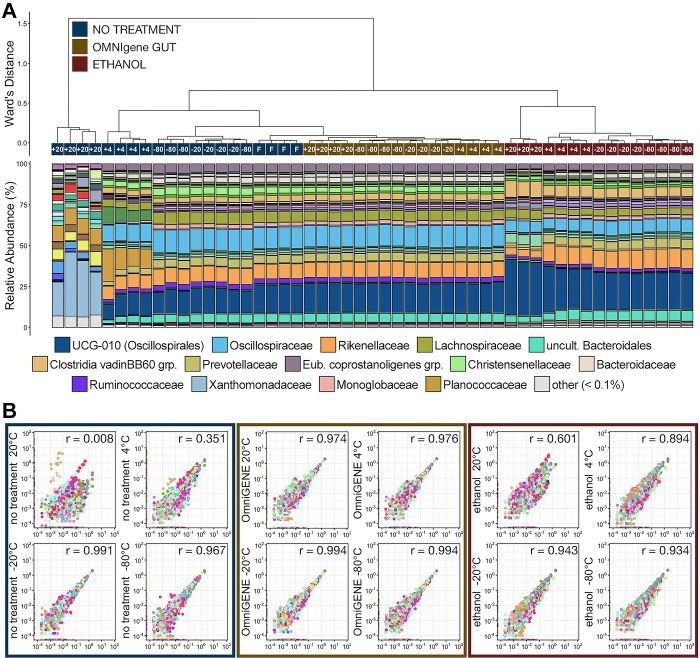
Fig 7.
A) The relatedness of microbial communities from samples extracted after 14-days storage at room temperature, 4°C, -20°C, or -80°C and stabilized with OMNIgene®•GUT solution, 100% ethanol, or given no stabilization solution (no treatment). Hierarchal clustering was performed on generalized UniFrac distances using Ward’s agglomeration method. The bar plot illustrates the relative abundance of microbial families within each individual family. The fifteen most abundant families across all 14-day storage samples are displayed in the legend. B) Scatterplots showing the correlation between the relative abundance of every ASV between samples from each treatment group and storage temperature after 14-days storage and no treatment samples that were extracted immediately.

