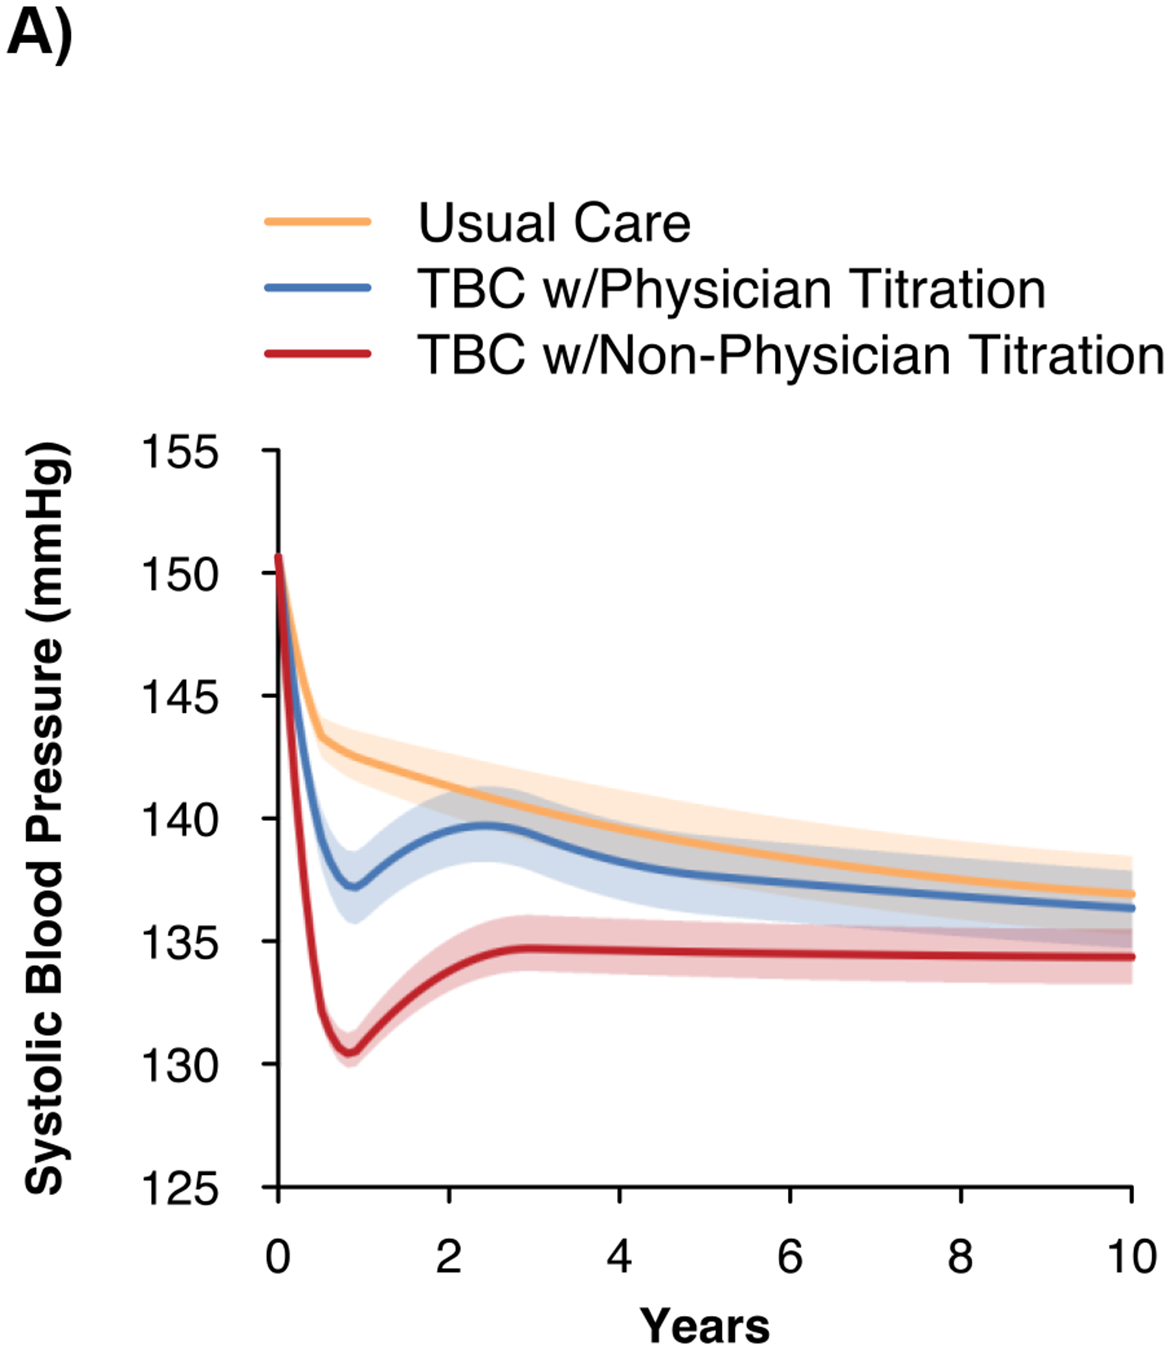
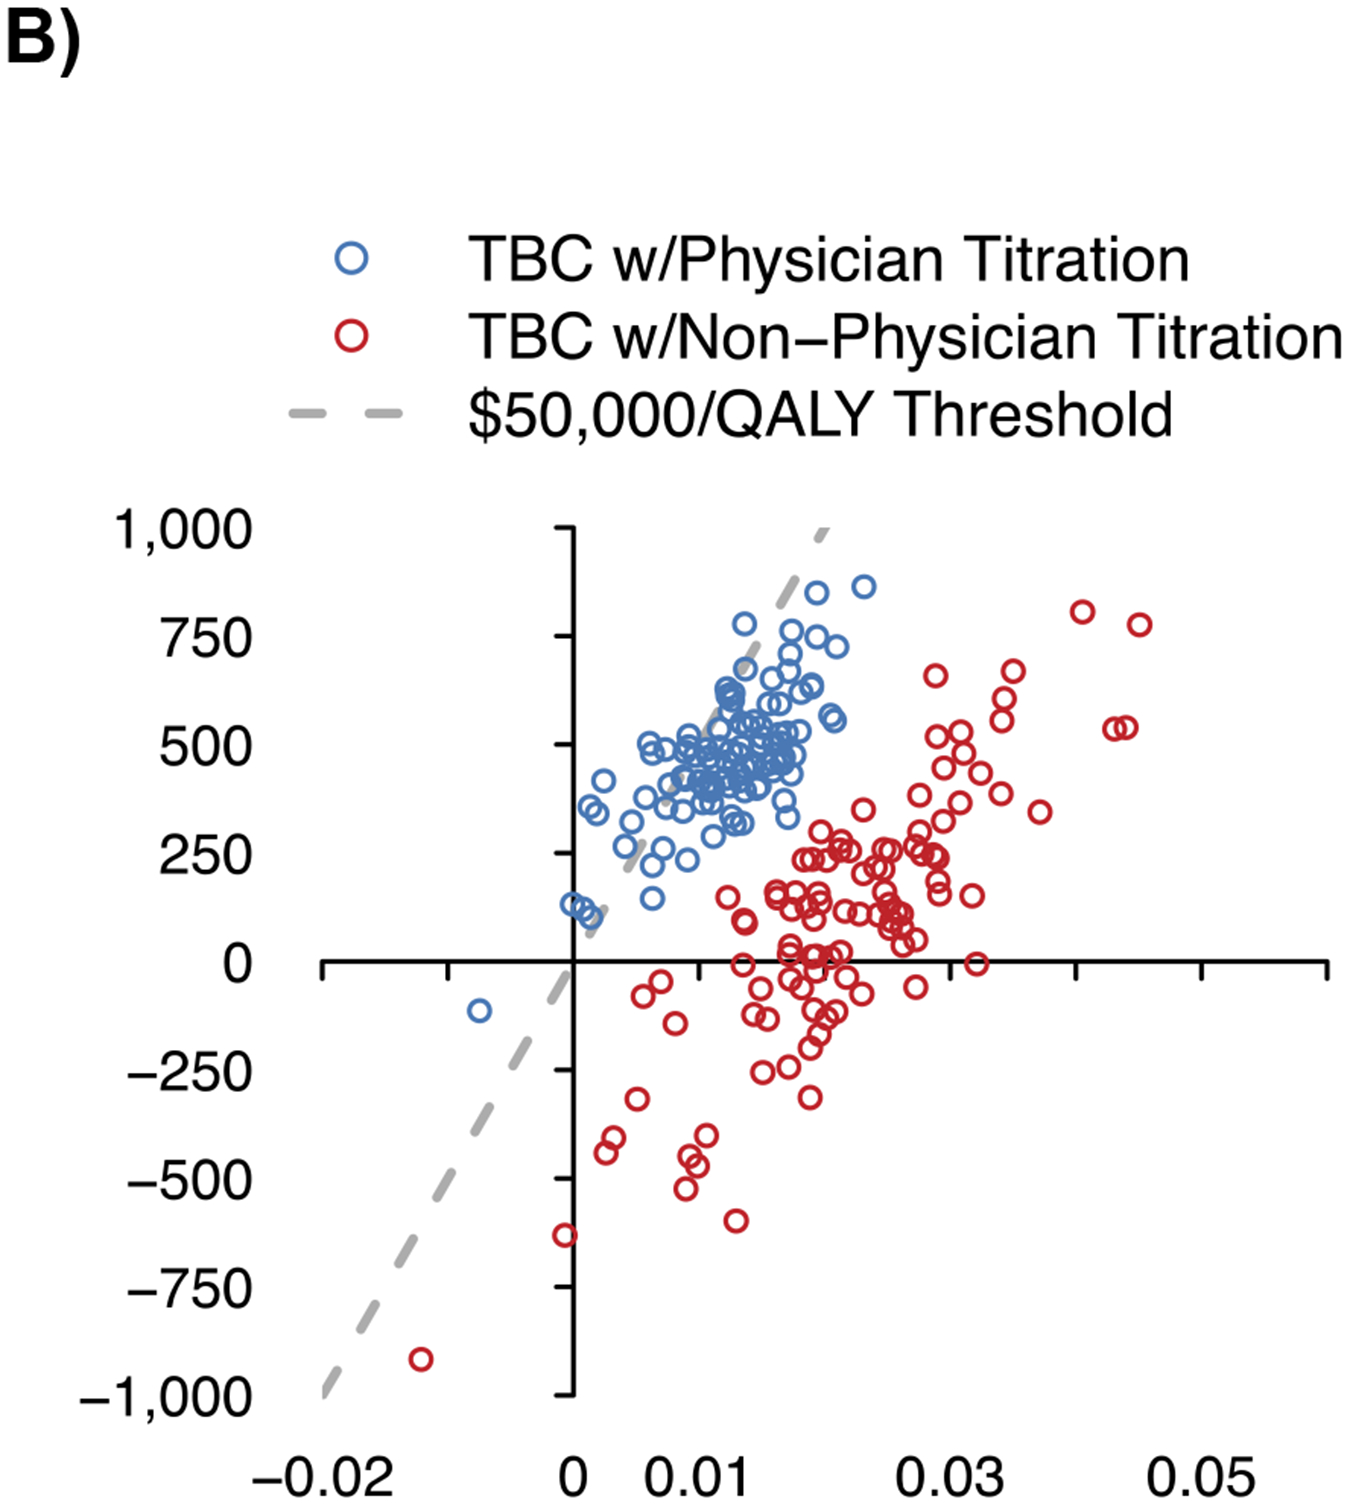
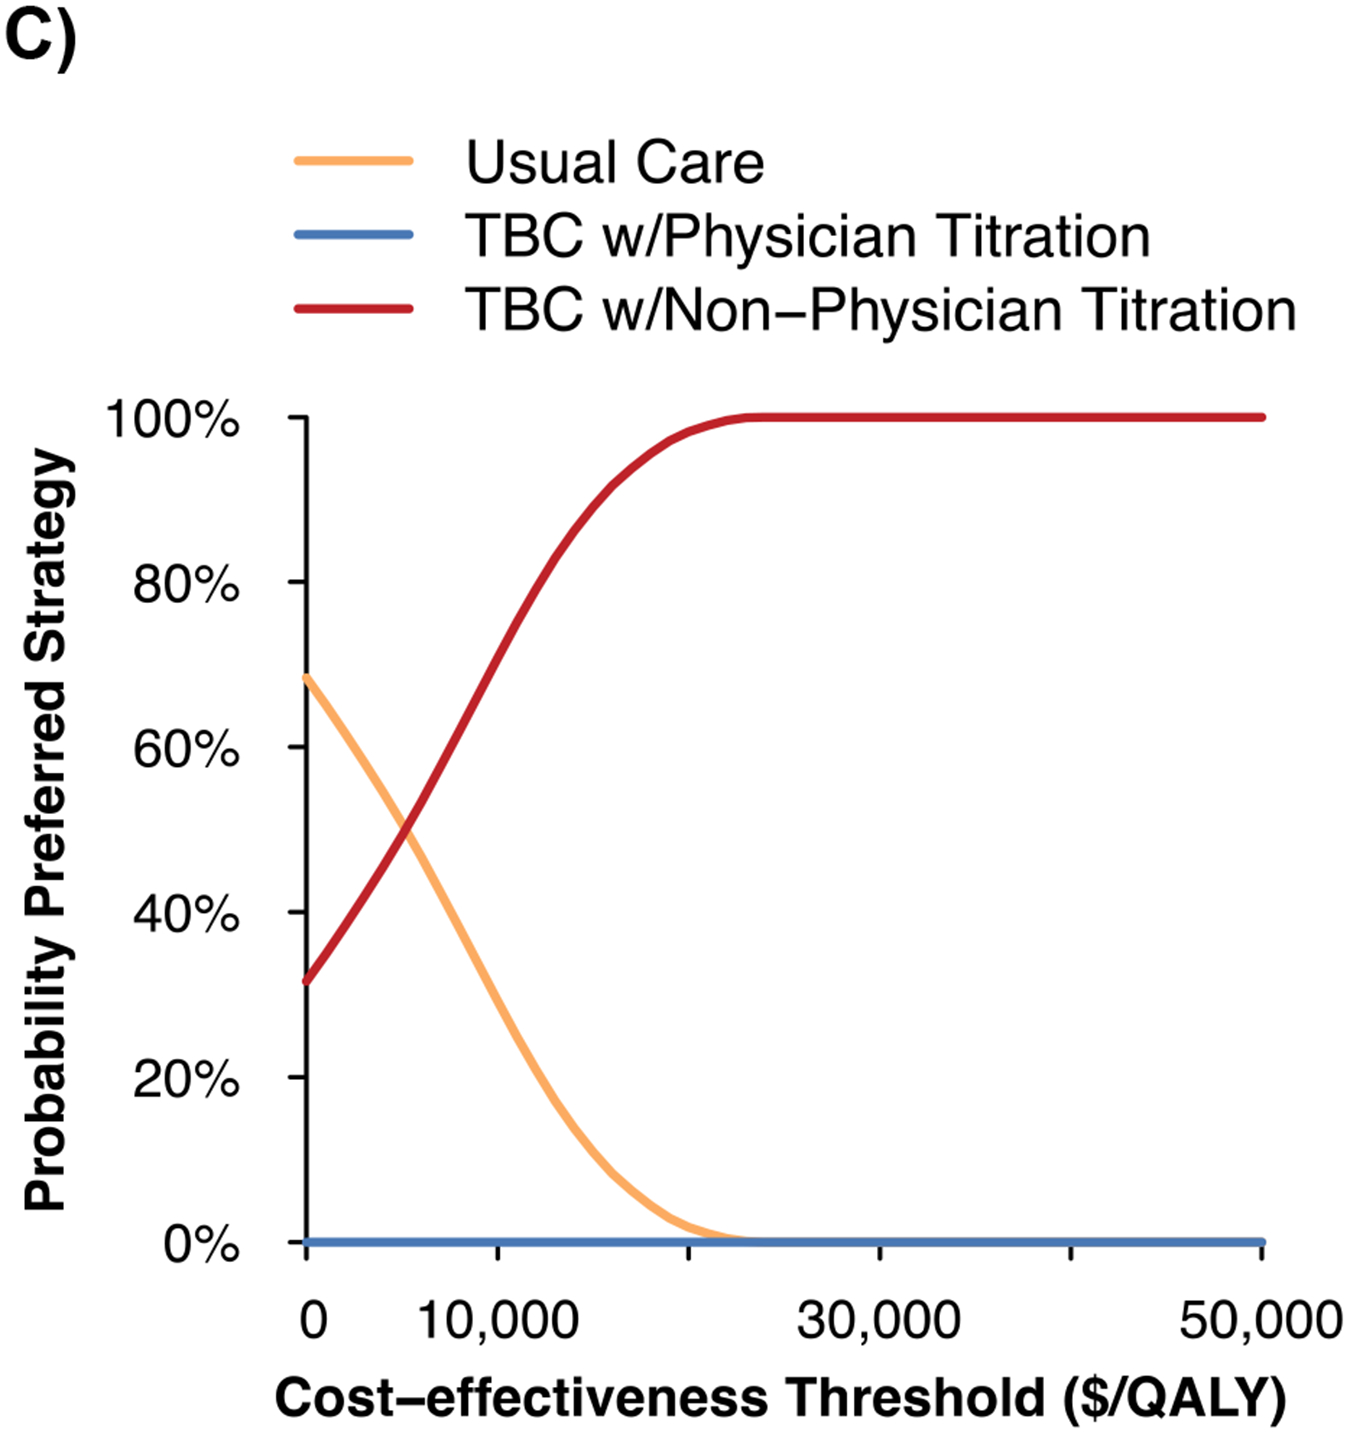
Figure 2. Projected systolic blood pressure outcomes and cost-effectiveness of team-based care.


A) Projected systolic blood pressure over time
B) Incremental costs and quality-adjusted life years vs. usual care
C) Cost-effectiveness acceptability curve
QALY – quality-adjusted life years, SBP – systolic blood pressure, TBC – team-based care, USD – United States dollars.
Notes: The figure shows the projected changes in SBP with each strategy over the simulated time horizon in Panel A, the incremental costs and incremental QALYs for TBC vs. usual care in Panel B, and the probability of TBC and usual care being the preferred strategy as the cost-effectiveness threshold is varied in Panel C. The shaded region in Panel A shows the 95% uncertainty interval from 100 probabilistic iterations of the model.
