. 2024 Apr 2;12:RP89136. doi: 10.7554/eLife.89136

Figure 5. Opposite effects of Chol-MCT1-siRNA versus GN-MCT1-siRNA on fibrotic type 1 collagen expression.

Male ob/ob mice (10weeks, n=6) were subcutaneously injected with 10mg/kg of siRNA once every 10days. Mice were fed a Gubra Amylin NASH (GAN) diet for 3weeks and sacrificed. Representative fibrogenic gene expression levels were measured for (A, B) mRNA and (C, D) protein. (E, F) Protein expression levels were quantified. (G) Livers were stained with Sirius Red and the representative images of each group are shown (scale bar: 200 µm). (H) % of Sirius Red positive areas were quantified (mean ± SD, t-test, *: p<0.05, **: p<0.01, ***: p<0.001).

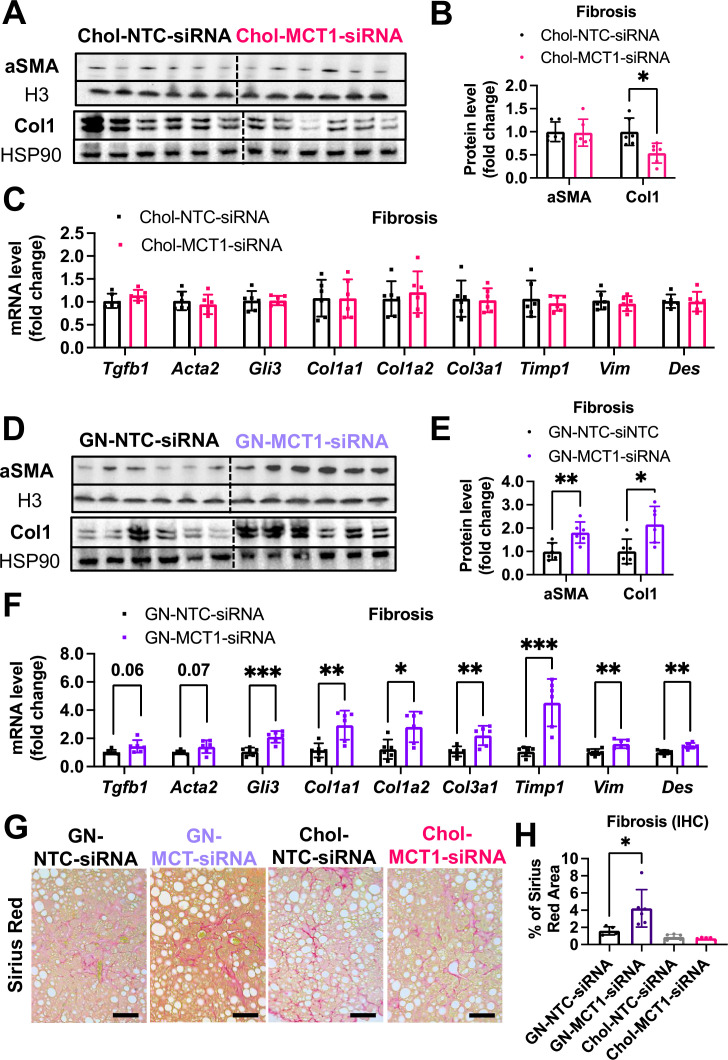
Figure 5—source code 1. Opposite effects of Chol-MCT1-siRNA versus GN-MCT1-siRNA on fibrotic type 1 collagen expression.
Figure 5—source data 1. Opposite effects of Chol-MCT1-siRNA versus GN-MCT1-siRNA on fibrotic type 1 collagen expression.

Figure 5.

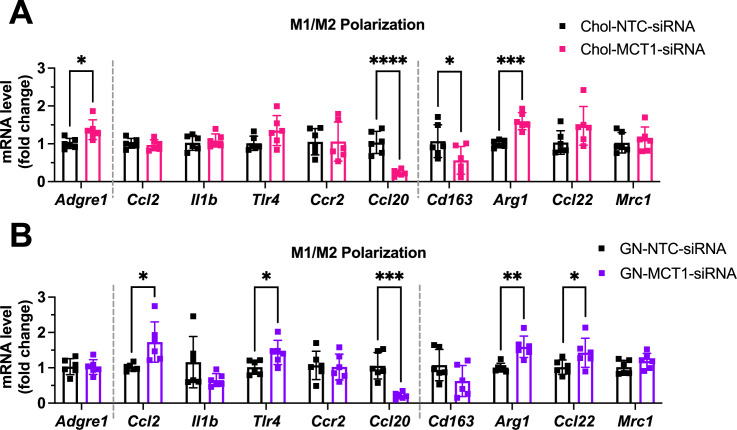
Figure 5—figure supplement 1. A comparable level of M1/M2 macrophage polarization upon Chol-MCT1-siRNA and GN-MCT1-siRNA administration.

Figure 5—figure supplement 1.

Male ob/ob mice (10weeks, n=6) were subcutaneously injected with 10mg/kg of siRNA once every 10days. Mice were fed a Gubra Amylin NASH (GAN) diet for 3weeks and sacrificed. Representative pro-inflammatory M1 markers and pro-fibrogenic M2 macrophage gene expression levels were measured in (A, B) upon Chol-siRNA or GN-siRNA administration, respectively (mean ± SD, t-test, *: p<0.05, **: p<0.01, ***: p<0.001, ****: p<0.0001).
Figure 5—figure supplement 1—source data 1. A comparable level of M1/M2 macrophage polarization upon Chol-MCT1-siRNA and GN-MCT1-siRNA administration.
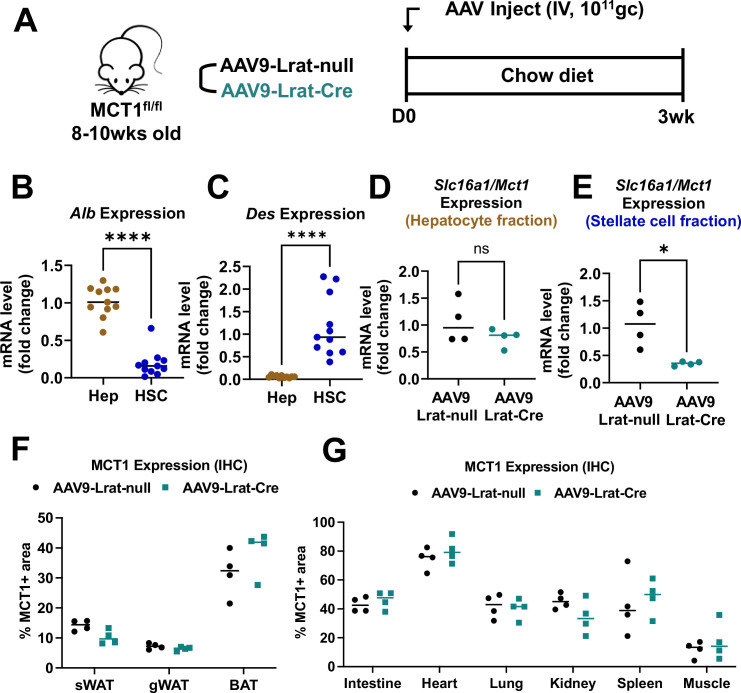
Figure 5—figure supplement 2. Intravenous injection of AAV9-Lrat-Cre in MCT1fl/fl mice specifically targets hepatic stellate cells.

Figure 5—figure supplement 2.

(A) Male mice (9–10 weeks, n=4) were intravenously injected with 1×10¹¹ gc of either AAV9-Lrat-null or AAV9-Lrat-Cre. Mice were fed a chow diet for 3 weeks and sacrificed. Isolation of either (B) primary hepatocytes or (C) stellate cells was validated with each cell type’s representative marker, albumin and desmin, respectively. Slc16a1/Mct1 mRNA expression levels in (D) hepatocyte or (E) stellate cell fractions were examined (mean ± SD, t-test, *: p<0.05, ****: p<0.0001). (F) MCT1 protein expression levels in multiple fat tissues (inguinal white adipose tissue [iWAT], gonadal white adipose tissue [gWAT], and brown adipose tissue [BAT]) were monitored by immunohistochemistry. % MCT1 positive areas were quantified. (G) MCT1 protein expression levels in multiple tissues (heart, lung, kidney, spleen, and intestine) were monitored by immunohistochemistry. % MCT1 positive areas were quantified.
Figure 5—figure supplement 2—source data 1. Intravenous injection of AAV9-Lrat-Cre in MCT1fl/fl mice specifically targets hepatic stellate cells.