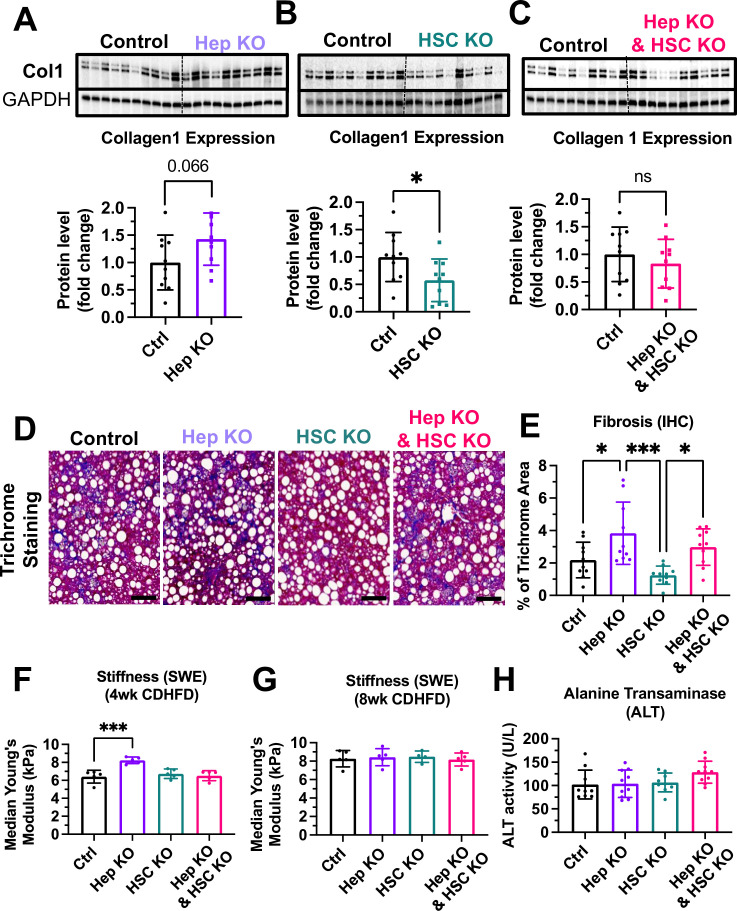
Figure 7. Hepatocyte-specific MCT1KO accelerated fibrosis, while hepatic stellate cell-specific MCT1KO decreased it.
Male MCT1fl/fl mice (6 weeks, n=10) were intravenously injected with 2×10¹¹ gc of AAV-TBG-Cre or AAV-Lrat-Cre or both. The same amount of AAV-TBG-null or AAV-Lrat-null was used as a control. A week after the injection, mice were fed a choline-deficient, high-fat diet (CDHFD) for 8 weeks and sacrificed. (A) Collagen 1 protein levels were compared between the control and the hepatocyte MCT1KO groups. (B) Collagen 1 protein levels were compared between the control and the hepatic stellate cell MCT1KO groups. (C) Collagen 1 protein levels were compared between the control group and MCT1KO in both hepatocyte and hepatic stellate cell groups. (D) Livers were stained with trichrome and the representative images of each group were shown (scale bar: 100 µm). (E) Trichrome staining images were quantified. (F) Liver stiffness was monitored 4 weeks after CDHFD feeding via shear wave elastography (SWE). (G) Liver stiffness was monitored 8 weeks after CDHFD feeding via SWE. (H) Alanine transaminase (ALT) levels were measured in every CDHFD-fed group (mean ± SD, t-test, one-way ANOVA, *: p<0.05, **: p<0.01, ***: p<0.001, ****: p<0.0001).

