. 2024 Apr 2;12:RP88253. doi: 10.7554/eLife.88253

Figure 3. Temporal progression of egg retention and internal hatching.

(A) Egg retention in a subset of 15 strains with divergent egg retention, divided into the three phenotypic classes. Class I weak:<10 eggs in utero (N=34), Class II canonical: 10–25 eggs in utero (N=230), Class III strong:>25 eggs in utero (N=14). Class III strains were further distinguished depending on the absence (Class IIIA) or presence (Class IIIB) of the KCNL-1 V530L variant explaining strong egg retention. Estimates of Class effects labelled with the same letter are not significantly different from each other (Tukey’s honestly significant difference, p>0.05) based on results of a Two-Way ANOVA, fixed effect Class: F3,577=710.38, p<0.0001, fixed effect Strain(nested in Class): F11,577=33.58, p<0.0001. (B) Geographic distribution of the 15 focal strains with divergent egg retention. (C) Temporal dynamics of offspring number in utero in the 15 focal strains. Number of eggs and larvae in utero at three stages covering the reproductive span of self-fertilizing hermaphrodites. N=28–96 individuals per strain per time point (except for JU2593: at mid-L4 +72 hr: only four individuals were scored as most animals were dead by this time point). (D) Age distribution of embryos retained in utero of hermaphrodites (mid-L4 +30 hr) in the 15 focal strains. Embryonic stages were divided into five age groups according to the following characteristics using Nomarski microscopy (Hall and Altun, 2007): 1–2 cell stage, 4–26 cell stage, 44 cell to gastrula stage, bean to two-fold stage, three-fold stage, L1 larva. (Data from same cohort of animals used for experiment shown in A). (E) Frequency of internal hatching across three time points of the reproductive span of self-fertilizing hermaphrodites (extracted from data shown in D). Red bars indicate the proportion of individuals carrying at least one L1 larva in the uterus; blue bars indicate the proportion of individuals carrying only embryos in the uterus. Dead mothers were excluded from analyses.

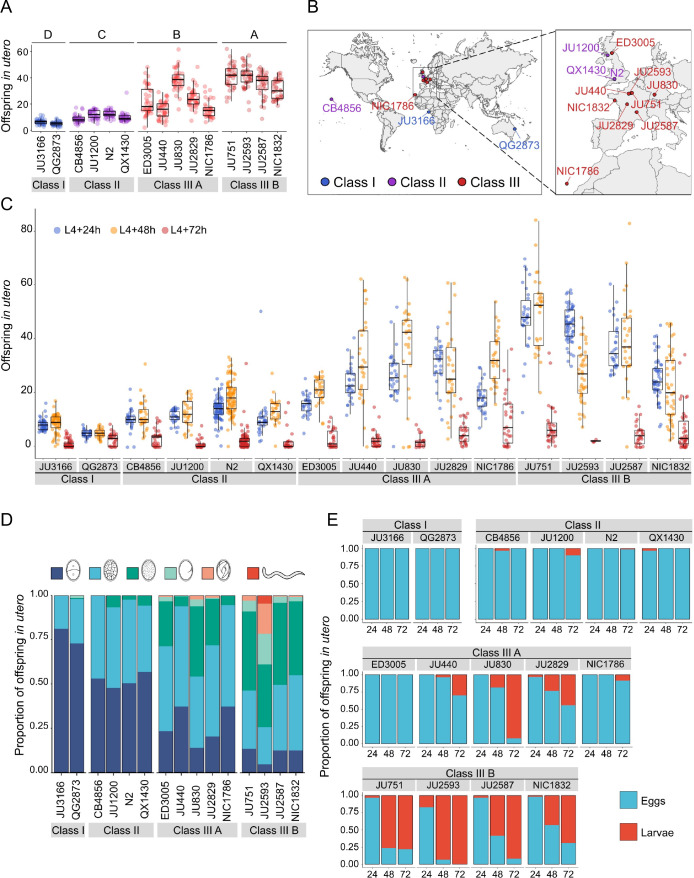
Figure 3—source data 1. Excel file containing source data for Figure 3, Figure 3—figure supplement 1A.

Figure 3.

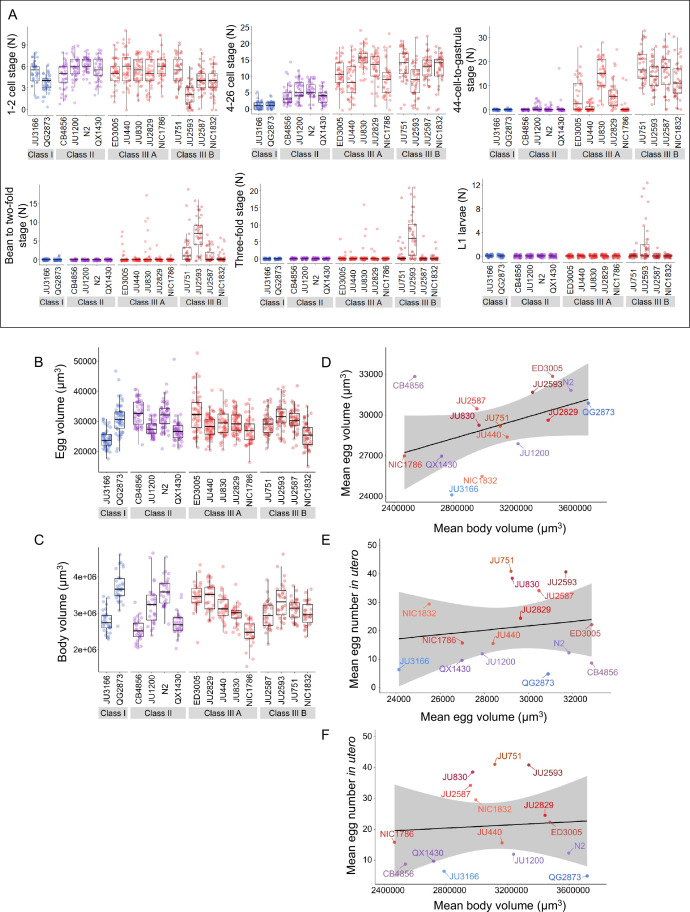
Figure 3—figure supplement 1. Temporal progression of egg retention and internal hatching.

Figure 3—figure supplement 1.

(A) Age distribution of embryos within eggs retained in utero of hermaphrodites (L4 +30 hr) in the 15 focal strains, including the N2-derived strain QX1430 (Andersen et al., 2015). Embryonic stages were divided into five age groups according to the following characteristics using Nomarski microscopy (Hall and Altun, 2007): 1–2 cell stage, 4–26 cell stage, 44 cell to gastrula stage, bean to two-fold stage, three-fold stage, L1 larva. N=36–40 individuals were scored per strain; data obtained from same individuals scored for number of eggs in utero (Figure 3A). (B) Egg size (volume) in the 15 focal strains with variable egg retention, measured on laid eggs of mixed-age adult populations. Strains differed significantly in egg size (Kruskal-Wallis Test, χ2=223.97, df = 14, p<0.0001). N=50–69 eggs per strain. (C) Body size (volume) measured in the 15 focal strains; selfing hermaphrodites at first fertilization (1–2 eggs in utero). Strains differed significantly in body size (Kruskal-Wallis Test, χ2=227.45, df = 14, p<0.0001). N=47–51 individuals per strain. (D) Marginally significant positive correlation between mean egg size and mean body size (volume; at first fertilization, 1–2 eggs in utero) across the 15 focal strains with divergent egg retention (ρSpearman=0.50, p=0.06). (E) No correlation between mean egg size and mean egg retention (at L4 +30 hr) across the 15 focal strains with divergent egg retention (ρSpearman=0.01, p=0.98). (F) No correlation between mean body size (volume; at first fertilization, 1–2 eggs in utero) and mean egg retention (at L4 +30 hr) across the 15 focal strains with divergent egg retention (ρSpearman=0.1, p=0.92).
Figure 3—figure supplement 1—source data 1. Excel file containing source data for Figure 3—figure supplement 1B–F.