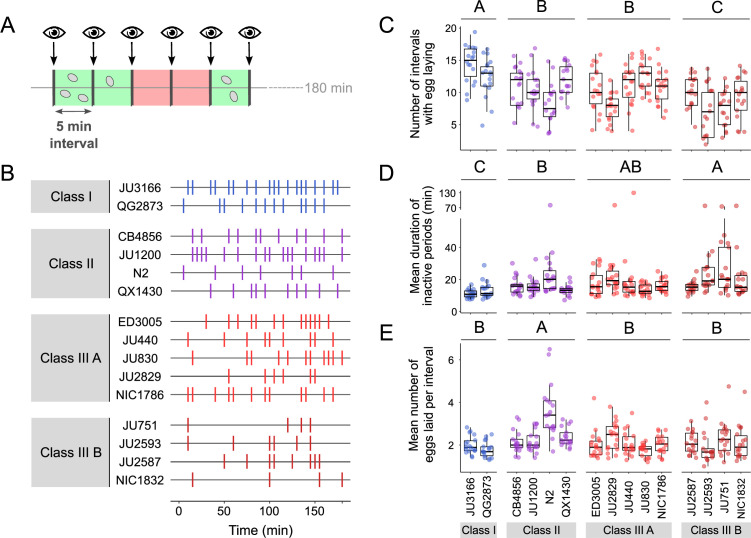
Figure 5. Natural variation in egg-laying behaviour.
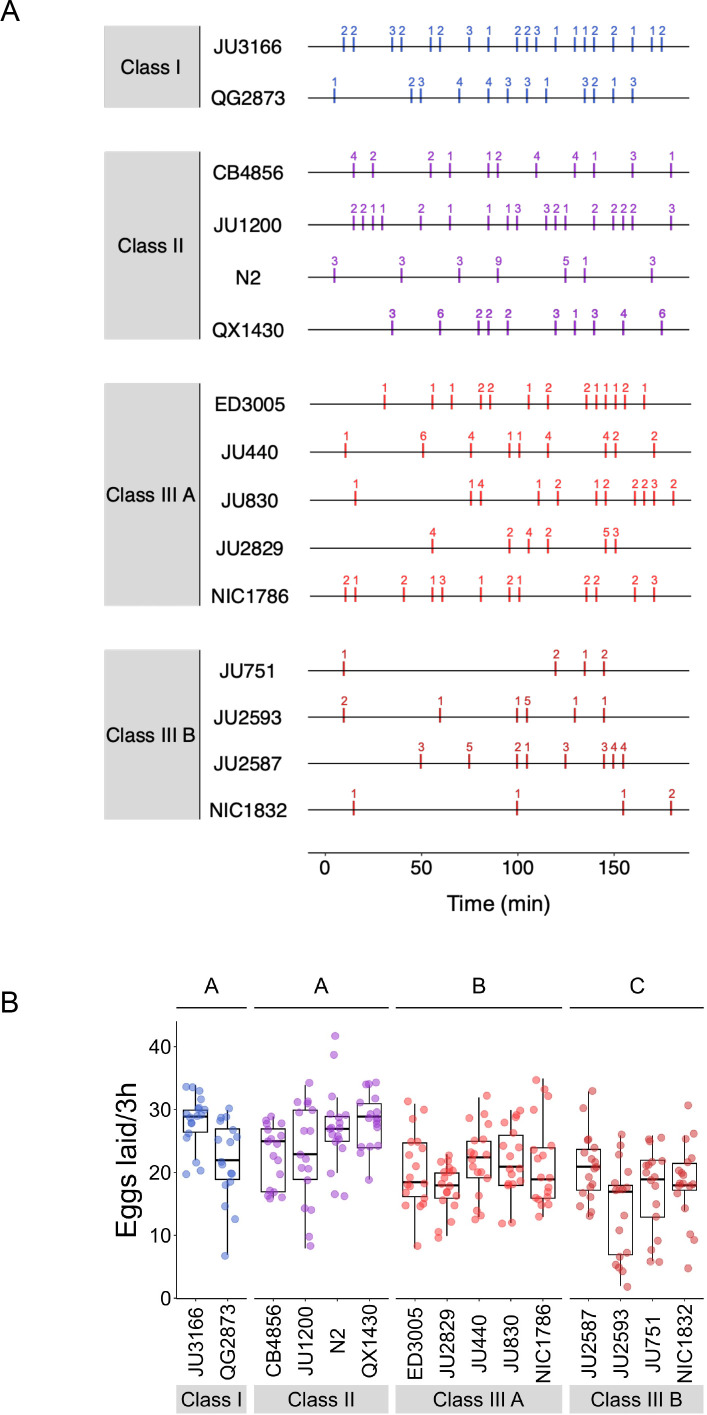
(A) Cartoon depicting the design of our scan-sampling experiment to quantify temporal patterns of C. elegans egg-laying behaviour in the 15 focal strains (B–E). We scored the presence and number of eggs laid by isolated adults (at mid-L4 +30 hr every 5 min across a 3-hr period, resulting in a total of 36 observations [intervals] per individual [N=17–18 individuals per strain]). Intervals with and without egg laying are marked in green and red, respectively. (B) Raster plots illustrating strain variation in temporal patterns of egg-laying behaviour across 3 hr of observation. Each horizontal line represents single individual and vertical bars indicate 5-min intervals during which one or more eggs were laid. For a detailed figure of the same data, see Figure 5—figure supplement 1A. (C) The number of 5-min intervals with egg laying differed significantly between strains and Classes. Two-Way ANOVA, fixed effect Class: F3,248=19.94, p<0.0001, fixed effect Strain(nested in Class): F11,248=5.20, p<0.0001. Estimates of Class effects labelled with the same letter are not significantly different from each other (Tukey’s honestly significant difference, p<0.05). Each dot represents the number of intervals with egg laying (out of a total of 37 intervals) per individual (N=17–18 individuals per strain). (D) The estimated mean duration of inactive periods (min) differed significantly between strains and Classes. Two-Way ANOVA, fixed effect Class: F3,248=8.46, p<0.0001, fixed effect Strain(nested in Class): F11,248=2.93, p=0.0012. Estimates of Class effects labelled with the same letter are not significantly different from each other (Tukey’s honestly significant difference, p>0.05). For each individual, this value was estimated as the mean time (corresponding to the number of intervals without egg laying) separating successive intervals with egg laying. Each dot represents the mean duration of inactive periods (min) per individual (N=17–18 individuals per strain). (E) The mean number of eggs laid per interval with egg laying differed between strains and Classes. Two-Way ANOVA, fixed effect Class: F3,248=12.41, p<0.0001, fixed effect Strain(nested in Class): F11,248=6.30, p<0.0001. Estimates of Class effects labelled with the same letter are not significantly different from each other (Tukey’s honestly significant difference, p>0.05). These significant effects are exclusively explained by the higher value of the N2 strain (Class II) relative to all other strains (p<0.05); none of the strains other than N2 did differ significantly from each other. Each dot represents the mean number of eggs laid per interval with egg laying per individual (N=17–18 individuals per strain). For data on total number eggs laid during the three-hour experiment, see Figure 5—figure supplement 1B.


