
Figure 5.
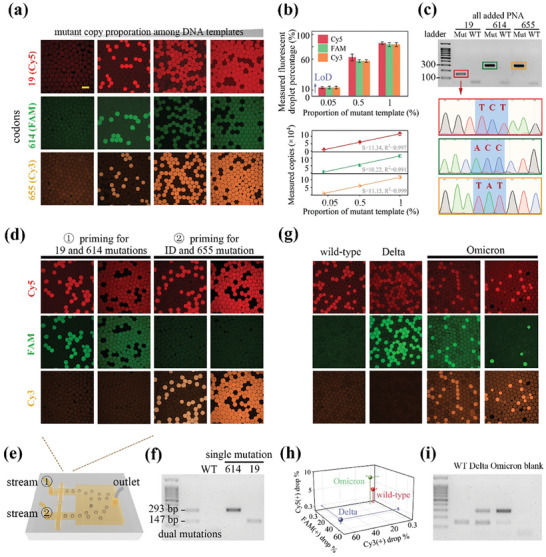
PNA‐assisted photothermal dPCR screening codon 19, 614 and 655 signatures for viral identification and VoC discrimination. a) Confocal fluorescence images showing PNA‐assisted post‐dPCR microcarriers at elevated concentrations of mutant template, using three different probes labeling. b) Observed bright drop percentages and deduced template abundance as functions of the expected amount of mutant‐type in the templates. Error bars, mean ± s.e.m. (n = 3). The LoD indicated by the dotted lines represented the mean + two‐fold of the s.e.m. from three negative control tests without DNA. c) Gel electrophoresis and Sanger sequencing analysis of the products derived from the droplets. d) Confocal fluorescence images showing two sets of duplex PNA‐assisted dPCR, detecting two DNA spike concentrations of 0.25 and 2.5 copies per drop, where Cy5, FAM, and Cy3 TaqMan probes were designed to label the presence of mutation at three respective codons. Viral identification was conducted utilizing codon 19′s primers without addition of the PNA. e) The combinational drop‐making chip was employed to pool the emulsions together for irradiation and fluorescence enumeration. f) Gel electrophoresis bands verified the successful detection of existing mutations of interest from the duplex assays. g) Confocal fluorescence images showing color patterns that enabled the differentiation of wild‐type, Omicron, and Delta variants through combinational duplex assays, with Omicron‐type plasmid inputs of 0.8 and 0.3 copies per drop. h) The color coordinates of VoC were divided into different intervals. i) Gel electrophoresis bands from VoC matched their mutation as regulated by PNA‐assisted PCR. Scale bar, 100 µm in (a, d, and g).