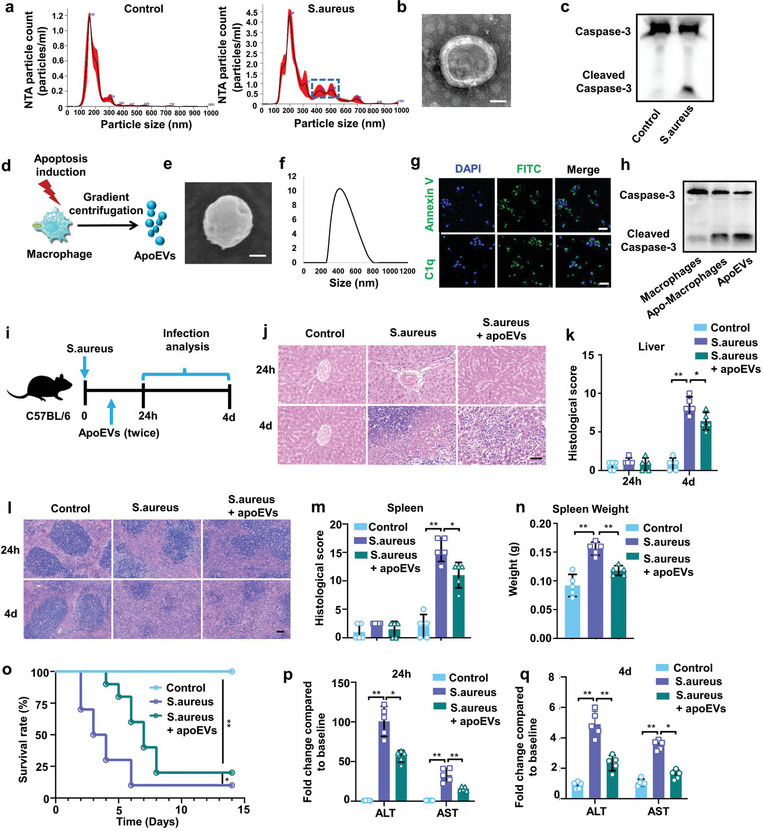
Figure 2.

ApoEVs released by apoptotic macrophages generate protecting effects on sepsis. a) Nanoparticle tracking analysis (NTA) showing the variety of extracellular vesicles present in serum of mice. Representative NTA profiles from uninfected and infected mice are shown. b) Representativae TEM image of apoEVs isolated from serum of infected mice. Scale bar, 200 nm. c) Representative western blot analyzing caspase‐3 levels in EVs isolated from uninfected or infected mice. d) Schematic diagram of the experimental procedure to induce macrophages apoptosis. Macrophages were incubated with STS for 4 h. The apoEVs were isolated by a gradient centrifugation protocol. e) Representative SEM image of apoEVs isolated from apoptotic macrophages. Scale bar, 200 nm. f) Size distribution of apoEVs. g) Annexin V and C1q staining of apoEVs. Scale bars, 20 µm. h) The expression of caspase‐3 and cleaved caspase‐3 in macrophages, apoptotic macrophages or apoEVs assessed by western blot. i) Schematic diagram of the in vivo experimental procedure. S. aureus infected mice were injected with apoEVs at 1 and 6 h after infection. j,k) H&E staining of representative liver sections j) and the associated histological scores k) at 24 h or 4 days after apoEVs injection. Scale bar, 50 µm. n = 5 mice. l,m) H&E staining of representative spleen sections l) and the associated histological scores m) at 24 h or 4 days after apoEVs injection. Scale bar, 50 µm. n = 5 mice. n) The spleen weight at 4 days after apoEVs injection. n = 5 mice. o) Survival of uninfected mice, infected mice, or infected mice receiving apoEVs. n = 10 mice. p,q) ALT and AST levels in the serum of uninfected mice, infected mice, or infected mice receiving apoEVs. n = 5 mice. All results are representative of the data generated in at least three independent experiments. For (k,m,n,p,q) data are represented as the mean ± s.d. For (k,n,p,q) statistical significance was assessed by one‐way ANOVA with Tukey's post‐hoc test. For (m) statistical significance was assessed by Kruskal–Wallis test. For (n) statistical significance was assessed by the log‐rank test. * p < 0.05, ** p < 0.01.
