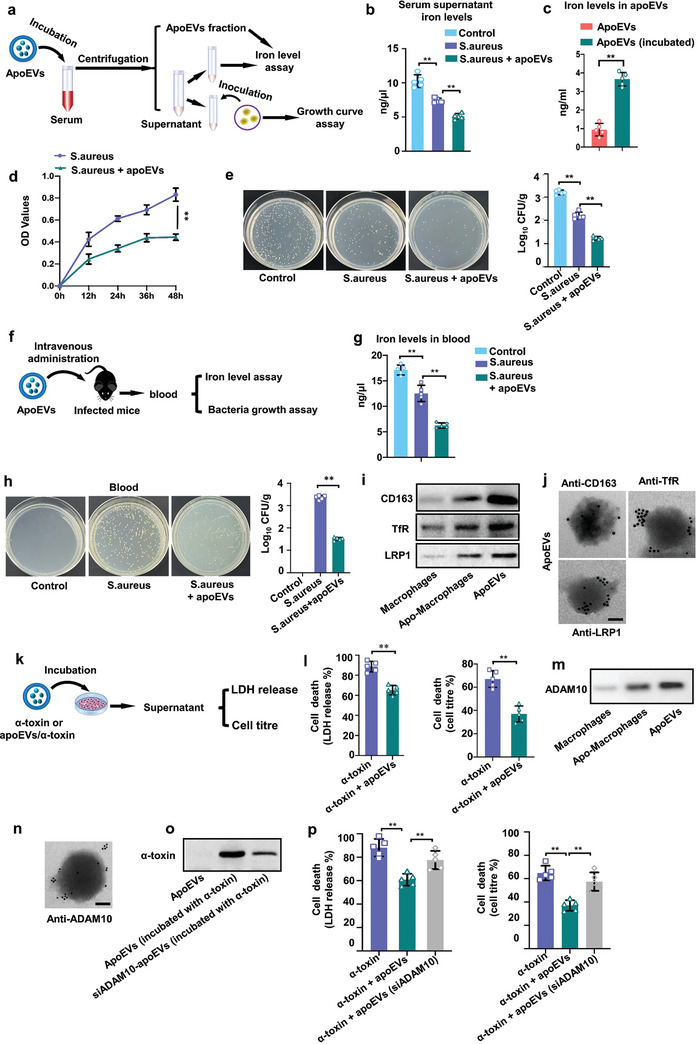
Figure 3.

ApoEVs released by apoptotic macrophages bind iron and protected against bacterial toxin. a) Schematic diagram of the experimental design to test the ability of apoEVs to bind iron in vitro. For in vitro studies, infected mice serum was incubated with apoEVs. Then the apoEVs were isolated by gradient centrifugation protocol. The serum supernatant was used for further analysis. b) Total iron levels in the serum supernatant. n = 5. c) Iron levels in apoEVs fractions after incubation with EVs‐depleted infected serum. n = 5. d) Growth curve of S. aureus in serum supernatant. n = 5. e) Viable count of S. aureus in serum supernatant. n = 5. f) Schematic diagram of the in vivo experimental procedure. For in vivo studies, infected mice received apoEVs (50 µg of membrane protein). The blood was used for further analysis. g) Total iron levels in blood at 12 h after S. aureus injection. h) Viable count of S. aureus in blood at 12 h after S. aureus injection. n = 5 mice. i) Western blot analysis of CD163, TfR and LRP1 expressions in macrophages, apoptotic macrophages, and apoEVs. j) Immunoelectron microscopy detection of CD163, TfR, LRP1 in apoEVs. Scale bar, 50 nm. k) Schematic diagram of the experimental design to test cell death. α‐toxin or apoEVs/α‐toxin mixture was incubated with A549 target cells. Cell viability was then determined either by LDH release or by metabolic activity. l) Cell death following treatment with α‐toxin together with apoEVs. n = 5. m) Western blot analysis of ADAM10 expression in macrophages, apoptotic macrophages, or in apoEVs. n) Immunoelectron microscopy detection of ADAM10 antibodies in apoEVs. Scale bar, 50 nm. o) Western blot analysis of α‐toxin neutralizing efficacy in apoEVs isolated from WT or ADAM10 knockdown cells. p) Cell death following treatment with S. aureus together with apoEVs (siADAM10) (apoptotic EVs derived from ADAM10 knockdown cells). n = 5. All results are representative of the data generated in at least three independent experiments. For (b,e,g,h,p) data are presented as means ± s.d., statistical significance was assessed by one‐way ANOVA with Tukey's post‐hoc test. For (c,l) statistical significance was assessed by unpaired two‐tailed Student's t test. * p < 0.05, ** p < 0.01.
