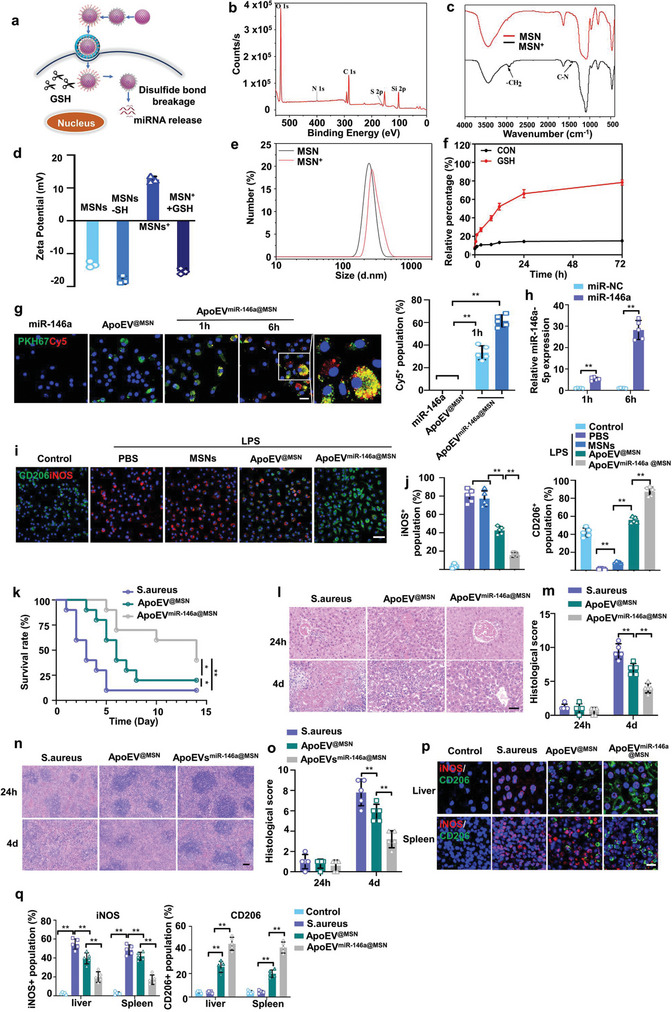
Figure 5.

Engineered apoEVs loaded with miR‐146a attenuated the bacteria‐induced inflammation. a) Schematic diagram of delivery of miR‐146a from apoEVmiR‐146a@MSN and intracellular release of miR‐146a in the cytosol. b) X‐ray photoelectron spectroscopy (XPS) spectra of 2‐dimethylaminoethanethiol‐modified MSNs (MSNs‐DMAET). c) Infrared spectrometry of DMA‐grafted MSNs with disulfide bonds. d) Zeta potential of MSNs after each step of functionalization to form MSNs+. n = 3. e) Size distribution of MSNs and MSNs+. n = 3. f) The miR‐146a release profile from MSNs with or without GSH. n = 3. g) Time‐dependent uptake of miR‐146a (red) from apoEV@MSN (green) by macrophages. Scale bars, 20 µm. h) Transfection efficiency of miR‐146a was determined by quantifying the miRNA level using real‐time quantitative PCR. n = 5. i,j) Representative fluorescence images of the macrophage phenotypes (i) and the percentage of the iNOS/CD206‐positive population(j). n = 5. Scale bars, 50 µm. k) Survival of uninfected mice, infected mice, infected mice receiving apoEV@MSN or apoEVmiR‐146a@MSN. n = 10 mice. l,m) H&E staining of representative liver sections l) and the associated histological scores m) at 24 h or 4 days after S. aureus infection. Scale bar, 50 µm. n = 5 mice. n,o) H&E staining of representative spleen sections n) and the associated histological scores o) at 24 h or 4 days after S. aureus infection. Scale bar, 50 µm. n = 5 mice. p,q) Representative fluorescence images of the macrophage phenotypes in liver or spleen p) and the percentage of the iNOS/CD206 positive population cells q) in each group. Scale bars, 50 µm. n = 5 mice. All results are representative of the data generated in at least three independent experiments. For (g,h,j,m,o,q) data are represented as the mean ± s.d., statistical significance was assessed by one‐way ANOVA with Tukey's post‐hoc test. For (k) statistical significance was assessed by the log‐rank test. * p < 0.05, ** p < 0.01.
