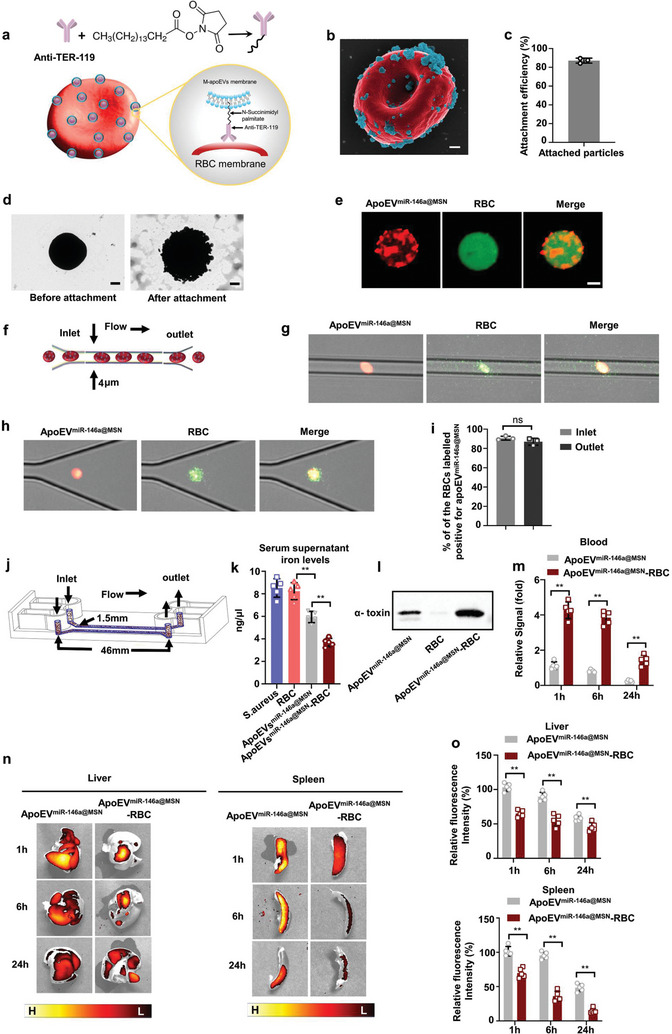
Figure 6.

Red blood cell‐hitchhiking boosts the therapeutic efficacy of apoEVmiR‐146a@MSN. a) Schematic of the attachment of apoEVmiR‐146a@MSN to RBCs through TER119‐PN binding complex. b) Scanning electron micrographs (pseudocolored red, RBC; pseudocolored green, apoEVmiR‐146a@MSN) of an example apoEVmiR‐146a@MSN‐RBC. Scale bar: 400 nm. c) Attachment efficiencies of apoEVmiR‐146a@MSN onto RBCs. n = 3. d) Transmission electron micrograph of RBC before or after apoEVsmiR‐146a@MSN attachment. Scale bar: 1 µm. e) Fluorescent images of apoEVmiR‐146a@MSN‐RBC. ApoEVmiR‐146a@MSN were labelled using Did (orange red) and the RBCs were labelled using 5‐(Octadecanoylamino) (green). Scale bar: 2 µm f) Schematics of the microfluidic chip. g) Fluorescently labeled apoEVmiR‐146a@MSN‐RBC were able to squeeze with ease through microchannels with a width of 4 µm, which is smaller than the size of RBCs (5–6 µm). h) RBCs preserved their integrity when collected at the outlet. i) Change in percentage of apoEVmiR‐146a@MSN‐RBC after squeezing through microfluidic channels was not statistically. j) Schematics of the flow chip. The flow channel is 46 mm long and 1.5 mm wide. k) Total iron levels in the serum supernatant. n = 5. l) Western blot analysis of α‐toxin neutralizing efficacy in unmodified apoEVmiR‐146a@MSN or apoEVmiR‐146a@MSN‐RBC. n = 5. m) In vivo circulation time of unmodified apoEVmiR‐146a@MSN or apoEVmiR‐146a@MSN‐RBC. n = 5 mice. n) Ex vivo fluorescent imaging of livers or spleen at various timepoints after systemic administration with unmodified apoEVmiR‐146a@MSN or apoEVmiR‐146a@MSN‐RBC. o) Comparison of the relative fluorescence intensities for unmodified apoEVmiR‐146a@MSN or apoEVmiR‐146a@MSN‐RBC in liver or spleen. n = 5 mice. All results are representative of the data generated in at least three independent experiments. For (i,m) data are represented as the mean ± s.d., statistical significance was assessed by unpaired two‐tailed Student's t test. For (k,o) data are represented as the mean ± s.d., statistical significance was assessed by one‐way ANOVA with Tukey's post‐hoc test. * p < 0.05, ** p < 0.01, ns, not significant.
