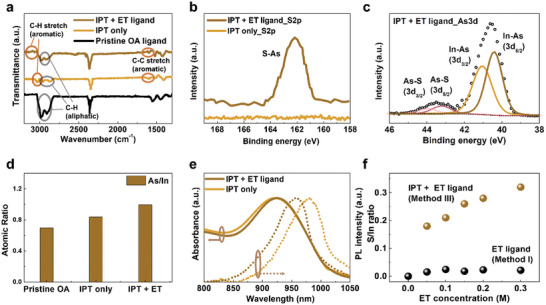
Figure 2.

Surface characterization of InAs CQDs with IPT. a) Fourier‐transform infrared spectroscopy (FTIR) measurements of InAs CQD solids using pristine oleic acid (OA) ligands (black), only IPT (dark orange), and ethanethiol (ET) ligands in conjunction with IPT (brown). b) XPS S 2p spectra of CQDs using ET ligand with IPT (brown) and only IPT (dark orange). c) XPS As 3d spectra of CQDs with ET ligands. d) As/In atomic ratio of pristine OA‐capped CQD (left), and IPT‐treated CQD inks before (middle) and after adding ET ligands (right). e) Normalized absorbance and PL spectra of CQD ink with only IPT (dark orange) and inks treated with ET ligands after IPT (brown). f) S/In ratio of ET‐treated CQD solids with (brown) and without IPT (black) depending on the concentration of the ET ligand precursor solution.
