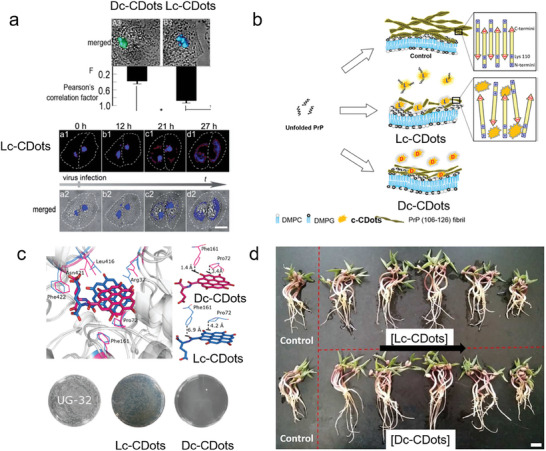
Figure 7.

Drug delivery of c‐CDots. a) Merged fluorescence and bright field images of c‐CDots and Pearson correlation factor between Golgi GFP and CQD calculated using Image Pro Plus 6.0. Fluorescence image of Golgi apparatus bodies of HEp‐2 cells stained with LC CQD.[ 77a ] Reproduced with permission from ref. [77a]. Copyright 2017. Royal Society of Chemistry. b) Proposed model for the effect of Lc_CDots on the inhibition of chiral PrP fibril.[ 48 ] Reproduced with permission from ref. [48]. Copyright 2018 Wiley‐VCH. (c) The different total binding free energy was calculated from the Dc‐CDots (hot pink sticks) and Lc‐CDots (blue sticks) (upper panel). Bottom panel: Antimicrobial activities of UG‐32, Dc‐CDots, and Lc‐CDots against E.coli shown by a standard plate count method.[ 77b ] Reproduced with permission from ref. [77b]. Copyright 2017 Wiley‐VCH. (d) Growth photography of mung bean treated with the Lc‐CDots and Dc‐CDots as the concentration increased from 0, 10, 50, 100, 500 to 1000 µg mL−1 during 5 days with natural light, respectively.[ 62a ] Reproduced with permission from ref. [62a]. Copyright 2018 Royal Society of Chemistry.
