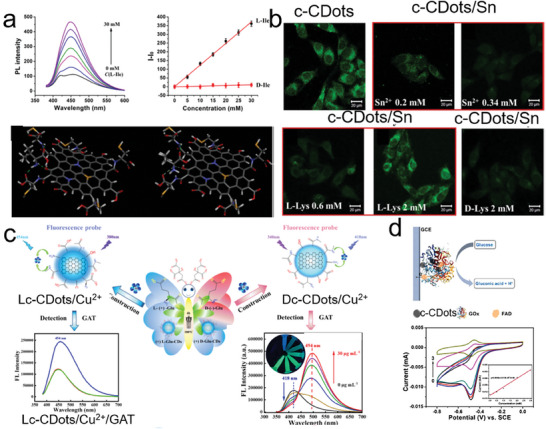
Figure 8.

Chemical or biosensing based on the c‐CDots. a) The intensity of PL spectra changes as the concentration of L‐Ile increases (right images in the upper panel). The linear relationship between the increase in PL intensity and the concentrations of L‐Ile (black dots) and D‐Ile (red dots) (left images in the upper panel). Molecular dynamic simulation for the interaction of chiral Ile molecules (right one: D‐Ile; left one: L‐Ile) and Lc‐CDots (bottom panel).[ 84 ] Reproduced with permission from ref. [84]. Copyright 2021 Elsevier. b) Confocal microscopy images of L929 cells treated with c‐CDots (0.1 mg mL−1) (null border image in upper panel) followed by the addition of Sn2+ (red border image in the upper panel). b) Confocal microscopy images of L929 cells treated with c‐CDots/Sn followed by the addition of L‐cys (red border image in the bottom panel) and D‐Cys (null border image in bottom panel).[ 79 ] Reproduced with permission from ref. [79]. Copyright 2020 Elsevier. c) The protocols for the fluorescence sensing of Cu2+ ions with the Lc‐CDots and Lc‐CDots, respectively.[ 97 ] Reproduced with permission from ref. [97]. Copyright 2022 Elsevier. d) Schematics of glucose sensors based on the c‐CDots/GOx (upper panel). CV curves of c‐CDots/GOx in the different glucose concentrations (bottom panels).[ 65 ] Reproduced with permission from ref. [65]. Copyright 2021 American Chemical Society.
