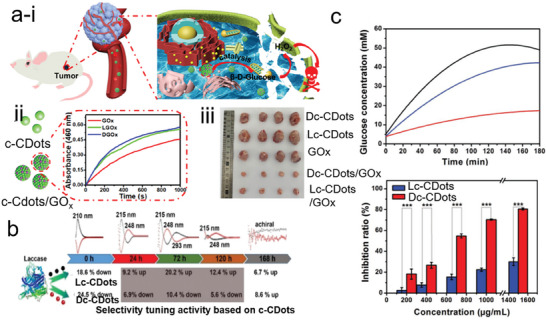
Figure 9.

a) i) Schematics of cancer therapy based on the regulation of H2O2 enzyme catalysis. ii) The absorbance of O‐dianisidine at 460 nm was recorded after the treatment with the GOx (red curve), Lc‐CDots/GOx (Green curve), and Dc‐CDots (blue curve). iii) Representative tumor images of mice after undergoing different treatments with nano drugs.[ 105 ] Reproduced with permission from ref. [105]. Copyright 2021. American Chemical Society. b) Schematic of catalytic performance of laccase after being treated with the different types of Lc‐CDots and Dc‐CDots.[ 72 ] Reproduced with permission from ref. [72]. Copyright 2018 Royal Society of Chemistry. c) The glucose concentrations were monitored at different hydrolysis times treated with maltase (black line), maltase/Lc‐CDots (blue line), and maltase/Dc‐CDots (red line), respectively (upper panel). The bar chart of the inhibition ratio with the different concentrations of maltase/Lc‐CDots (blue bar) and maltase/Dc‐CDots (red bar), respectively (bottom panel).[ 74 ] Reproduced with permission from ref. [74]. Copyright 2019 Wiley‐VCH.
