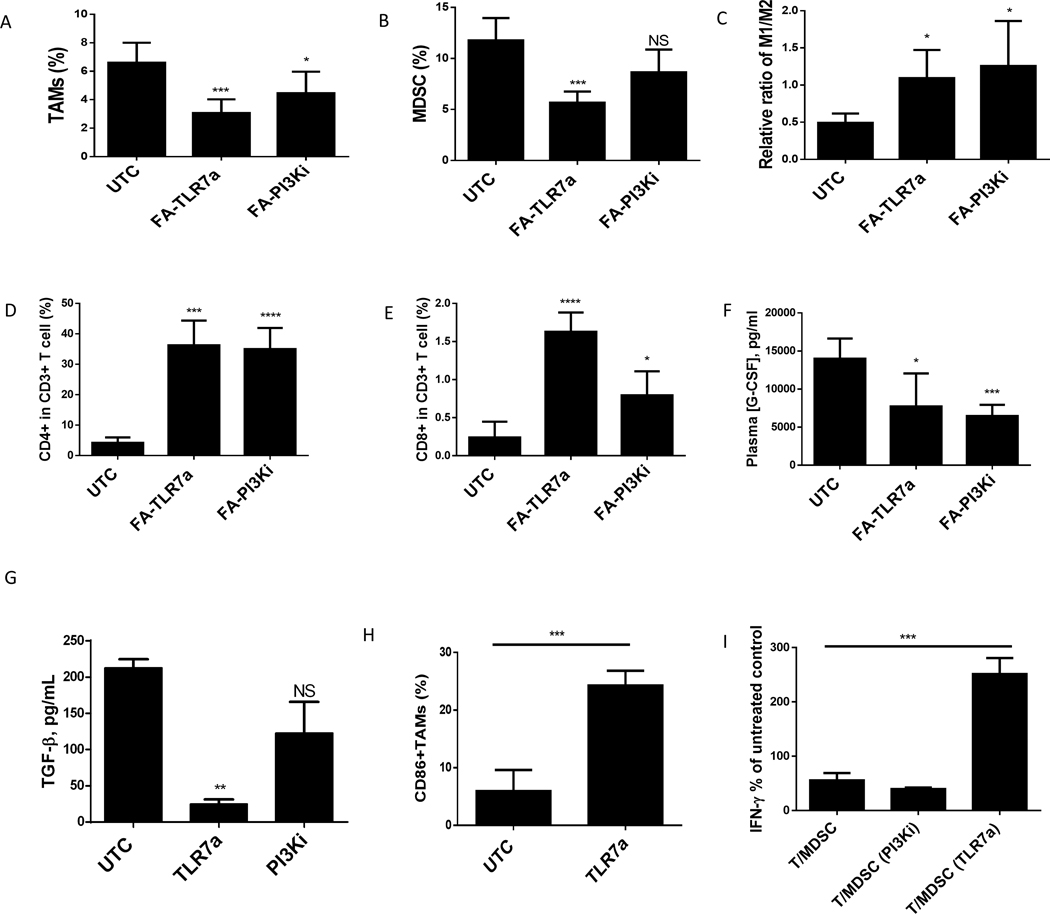
Figure 6: Repolarization of tumor associated M-MDSCs and TAMs observed after treatment TLR7a and PI3KI.
Determination of changes in intratumoral myeloid populations by in Balb/c mice (6–8 weeks old) that were implanted with 0.05 million 4T1 tumor (subcutaneous). On day 4 post tumor implantation, animals were treated with folate-conjugated (FA-TLR7A or FA-PI3KI) (10 nmol/mouse) daily for 2 weeks. After the animals were euthanized, the tumor was digested to analyze MDSCs, TAMs, and T cell populations. (A and B) MDSCs (A) and TAMs (B) percentage in tumor digests. (C) The ratio of M1 and M2 macrophages in tumor digests as determined by the ratio of CD86+ (M1) and CD206 (M2) percentages within total F4/80+ macrophages. (D) Percentage of CD4+ T cells in total CD3 T cell population from digested tumor cells. (E) Percentage of CD8+ T cells in total CD3 T cell population from digested tumor cells. (F) G-CSF levels in plasma at day 12 post tumor implantation.
Phenotypic changes in MDSCs and TAMs after in vitro treatment with reprogramming compounds. MDSCs/TAMs isolated from ascites of Balb/c mice (6–8 weeks old) implanted with 10 million 4T1 tumor (IP) were incubated with 1 μM TLR7 agonist or 1 μM PI3K inhibitor for 48 hours. (G) TGF-β concentrations. (H) CD86 expression on MDSCs measured by flow cytometry. (I) T cell suppression represented by percent positive CD8+IFNγ as compared to control T cells.
Data are compiled from two independent experiments with 4–5 mice per group.

