Figure 2.
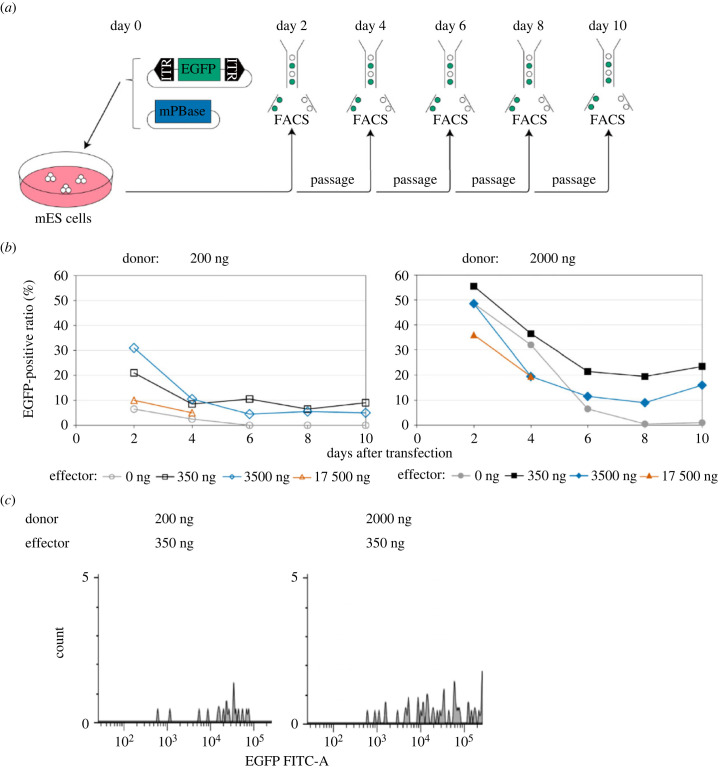
Evaluation of PiggyBac transposon integration. (a) Time course for evaluation of PiggyBac transposon (PB transposon) integration. The day when the donor vector carrying EGFP flanked by PiggyBac ITRs and the effector vector carrying mammalian codon-optimized PiggyBac transposase (mPBase) were transfected at several concentrations was defined as day 0. Fluorescence-activated cell sorting (FACS) was conducted every 2 days after transfection to confirm the ration of EGFP-positive mES cells. Passages were conducted using the remaining murine embryonic stem (mES) cells after FACS. (b) Ratio of EGFP-positive mES cells and days after transfection. EGFP-positive mES cells were calculated among a total of 200 mES cells passing quality filters by FACS. Blank symbols in the left figure indicate mES cells transfected with 200 ng of donor vector, and filled symbols in the right figure indicate those transfected with 2000 ng of donor vector. Grey circles, black squares, blue diamonds and orange triangles indicate mES cells transfected with 0, 350, 3500 and 17 500 ng of effector vector, respectively. We stopped evaluating mES cells transfected with a very high concentration (17 500 ng) of effector vector on day 4. (c) Histogram of EGFP-positive mES cells on day 10. The upper table shows the conditions of transfection. Lower histograms show all EGFP-positive mES cells in a total of 200 mES cells passing quality filters. The x-axis shows EGFP signal intensity, and the y-axis shows counts of EGFP-positive mES cells.

