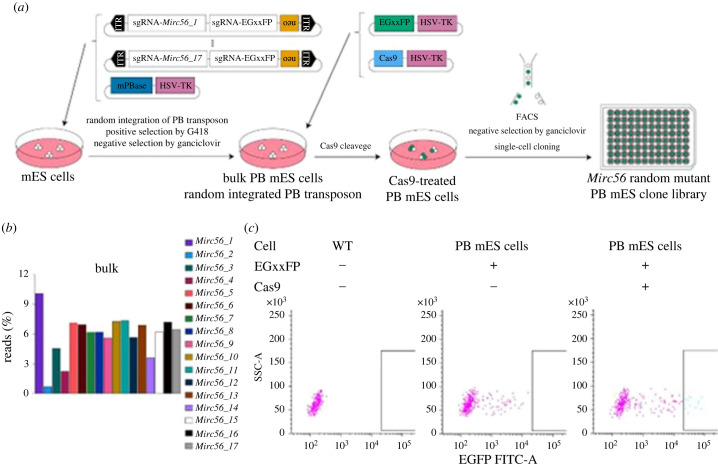
Figure 4.
Construction of the Mirc56 random mutant mES clone library. (a) Workflow for library construction. (b) Random integrated sgRNA-Mirc56_X cassettes in bulk PB mES cells. The bar colour shows each sgRNA-Mirc56_X cassette. The y-axis represents the percentage of reads with targeted amplicon short next-generation sequencing (NGS). (c) EGFP-based single-cell sorting in bulk PB mES cells. The upper table shows the conditions of transfection. Lower scatter graphs show each mES cell passing quality filters in a total of 2000 events. The y-axis shows the EGFP signal intensity. The boxes in scatter graphs show the gates of the EGFP filter.

