Figure 5.
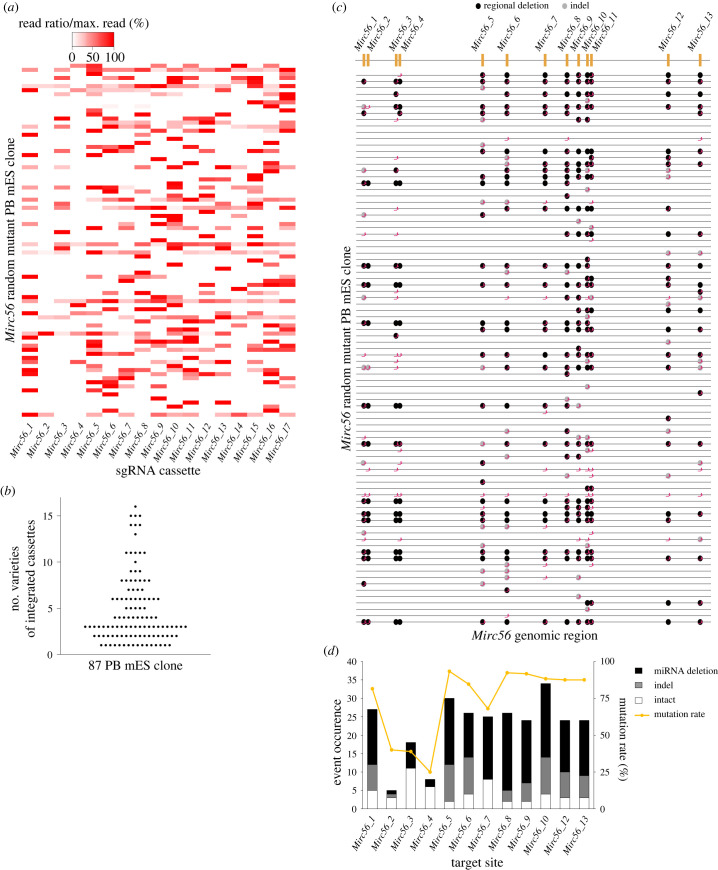
Evaluation of random integration and random mutation in the Mirc56 random mutant mES clone library. (a) Heatmap of integrated sgRNA cassettes in 87 Mirc56 random mutant clones. The read counts of each sgRNA cassette were divided by the maximum read counts in each Mirc56 random mutant clone. (b) Scatter graph with the number of varieties of integrated cassettes in 87 Mirc56 random mutant clones. (c) Genomic map of Mirc56 in 87 Mirc56 random mutant clones. The x-axis shows the genomic region of Mirc56_1, 2, 3, 4, 5, 6, 7, 8, 9, 10, 11, 12 and 13 without Mirc56_14, 15, 16 and 17. Magenta symbols indicate sgRNA target sites in each PB mES clone. (d) Mutations in target sites in 87 Mirc56 random mutant clones. The target sites do not include Mirc56_11, 14, 15, 16 and 17. The left vertical axis and bar graphs show event occurrence, while the right vertical axis and line graph show the mutation rate on target sites in 87 Mirc56 random mutant clones. The bar colour indicates each event (black: regional deletion, grey: Indel mutation, white: Intact).

