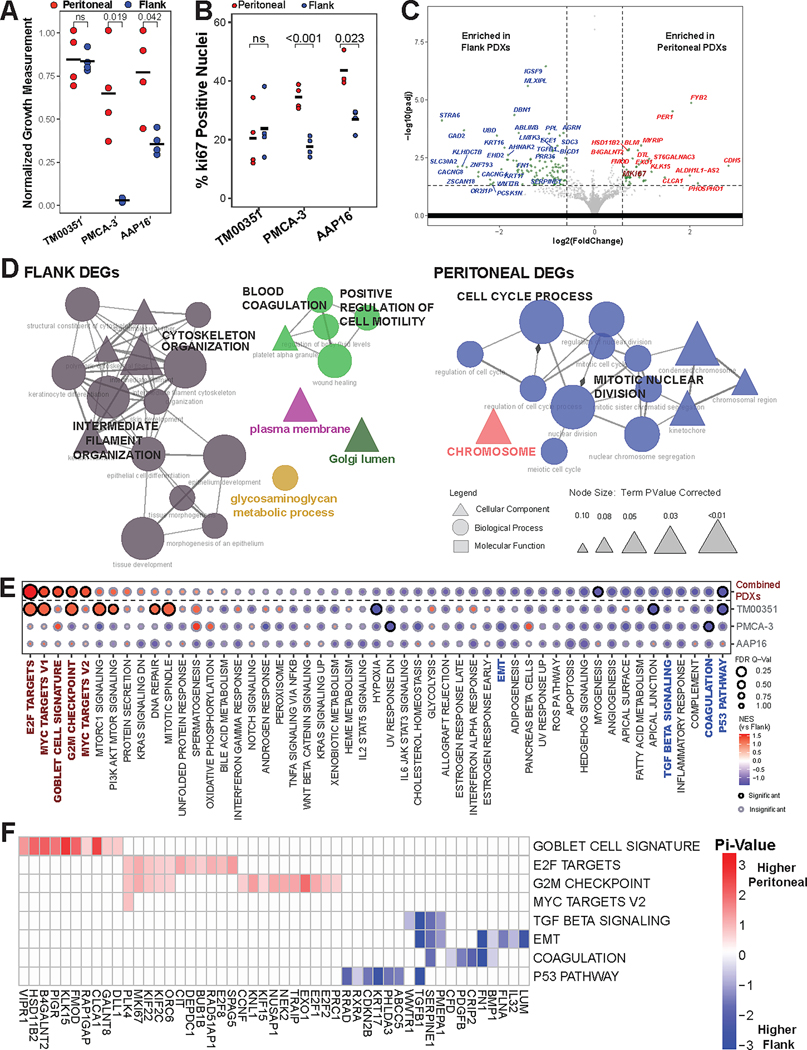
Figure 2. Peritoneal microenvironment influences tumor transcriptome to promote tumor growth.
(A) Normalized growth measurements separated by implant site for the three PDX models (pval by Student’s t-test, black bar = mean). Growth measurements were normalized to the highest measured value for each tumor and then plotted. (B) Quantification and comparison of percent of nuclei positive for Ki-67 (pval by Student’s t-Test, black bars = mean). (C) Volcano plot displaying differentially expressed genes (DEGs) from comparing intraperitoneal (IP) PDX tumor transcriptomes compared to flank PDX tumor transcriptomes. MKI67 is emphasized by size and color. (D) Individually generated ClueGO networks made from gene ontologies using either the flank enriched DEGs or the peritoneally enriched DEGs. Edge width denotes strength of overlap measured by the kappa score while node size denotes adjusted p-value. (E) Gene set enrichment analysis (GSEA) results for either all three models combined (top row) or each model separately (bottom three rows). Emphasized gene sets (color, bold) are further analyzed using leading edge analysis (LEA). (F) LEA results for emphasized gene sets from Fig 2E, only including genes with |pi-value|≥0.5.

