
Figure 3: SCS_sig characterization.
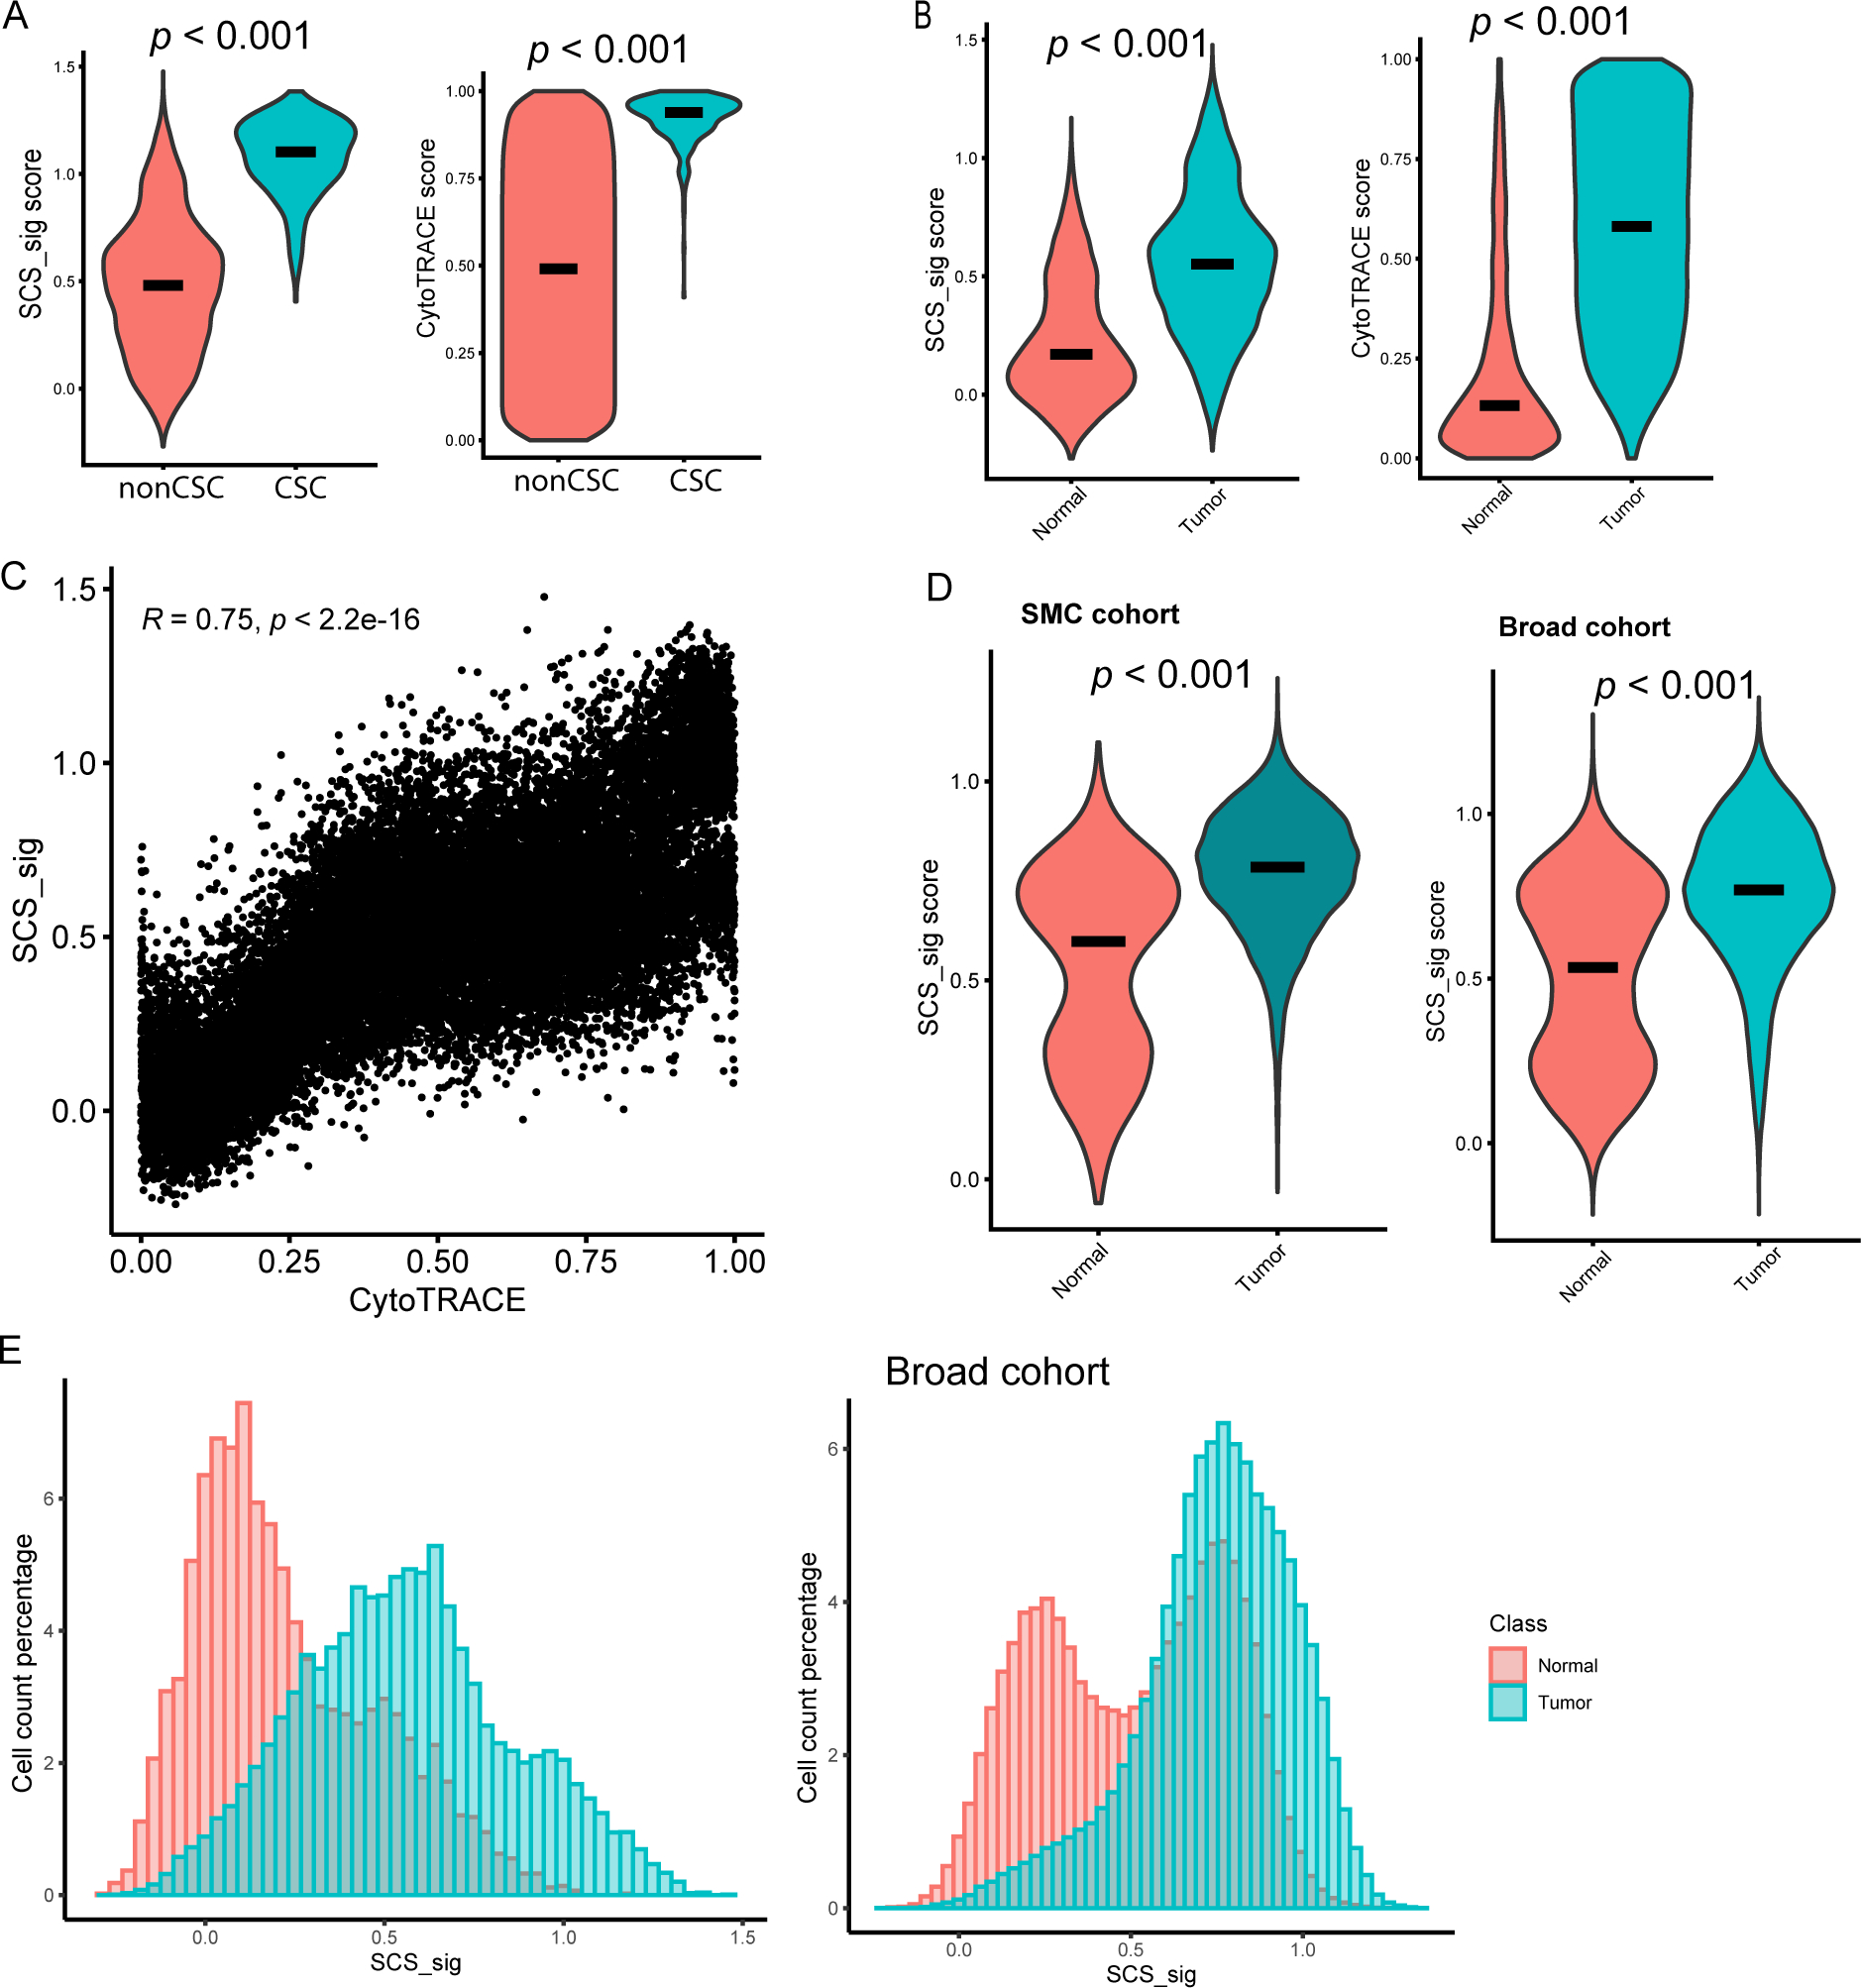
A and B, SCS_sig score (left) and CytoTRACE score (right) in non-CSC/CSC (A) and in normal/tumor cells (B). C, Spearman correlation coefficient of SCS_sig score and CytoTRACE score in epithelial cells. D, SCS_sig score in the Samsung Medical Center (SMC) cohort (left) and Broad cohort (right) epithelial cells by normal/tumor. E, Histogram showing the distribution of SCS_sig score in normal and tumor cells (MD Anderson data, left; Broad cohort data, right).