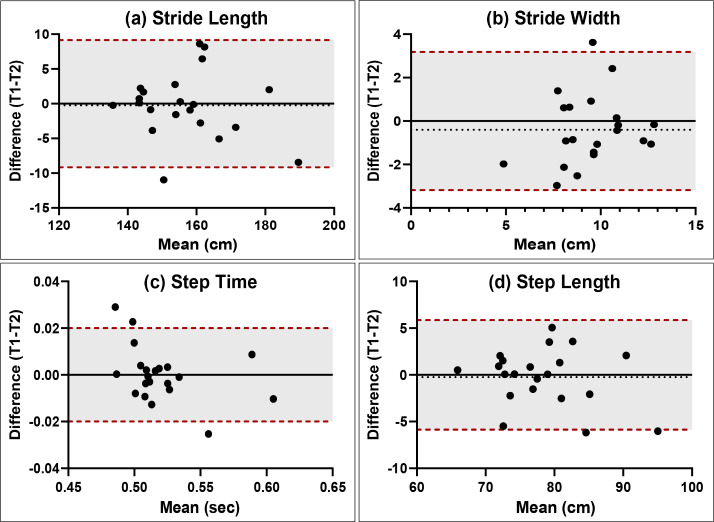
Figure 2. Sample Bland-Altman plots for spatiotemporal variables during walking.
The dashed red lines and shaded areas indicate limits of agreement equal to ±1 MDC. The dashed black line indicates the mean difference for all participants between the first and second testing sessions. The solid black line is included as a reference and indicates no difference between testing sessions. Plots for all variables are available in Appendix A. T1, baseline timepoint; T2, follow-up timepoint; cm, centimeters; sec, seconds

