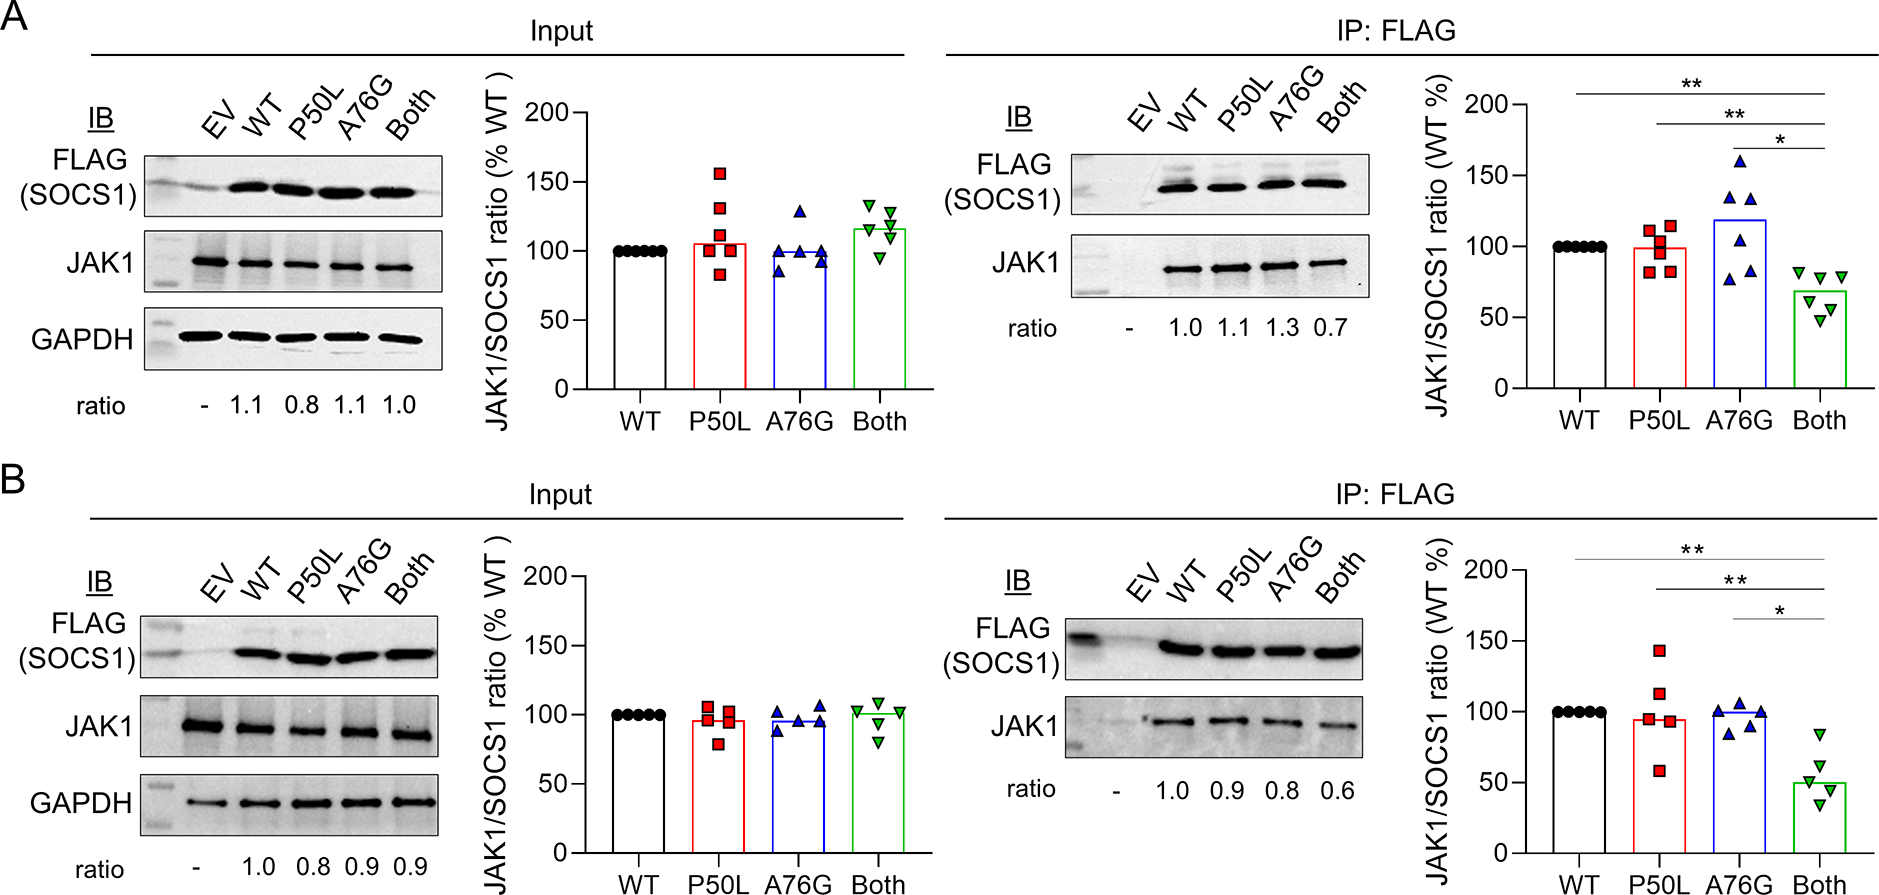
Figure 4. SOCS1 mutants and interaction with JAK1.

A) Immunoblot and densitometry analysis of JAK1/SOCS1 in transfected HEK293T cells before or after immunoprecipitation using anti-FLAG beads. The ratio of JAK1/SOCS1 expression is displayed. B) Immunoblotting and immunoprecipitation for the analysis of JAK1/SOCS1 interaction in IFN-α2-treated cells. Bands were quantified by densitometry analysis using Image J Software. Bar graphs illustrate the median of 6 independent experiments in panel A and 5 independent experiments in panel B. p < 0.05 (Mann Whitney U test).
