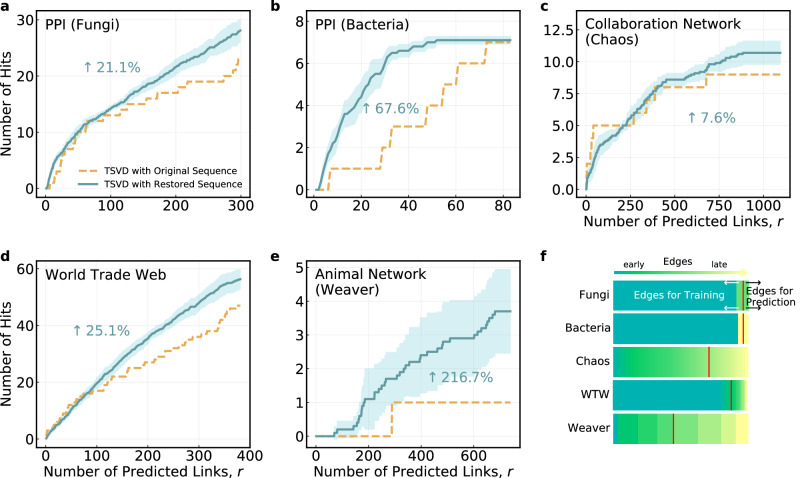
Fig. 6. Performance of link prediction.
Number of hits (correctly predicted edges) obtained by using the original (yellow dashed lines) and restored (blue solid lines) edge generation order on a PPI network (Fungi), b PPI network (Bacteria), c Collaboration network (Chaos), d World Trade Web, e Animal network (Weaver). For each network, we first remove the edges added in the last few snapshots. The number of edges removed is selected according to the number of snapshots in real network data (see f and Supplementary Table S10 for more details). Let Xoriginal and X be the collapsed weighted tensor constructed based on the original (i.e., the real network with a few snapshots) and the restored edge generation order, respectively. Then Xoriginal and X are used to calculate the corresponding score matrices and obtain the predicted future edges. The number of edges removed in the real network data that appear in the first r predicted future edges is termed the “Number of hits” and used to evaluate the link prediction performance. The percentage of improvement is computed based on the area under the curve. The weight parameter and the truncation parameter in the link prediction algorithm are tuned to get the optimal results for both the original and restored sequences, respectively. Results based on the restored sequences are averaged over 10 repeated simulations, with the light blue areas representing the 95% confidence intervals. f An illustration of the edges removed in different networks. Edges are arranged by real generation order with those added earlier to each network displayed in darker color. Edges after the red line are removed as the test set of link prediction. Note that the restored sequences used for link prediction are obtained using the same method as other tasks in this work but on networks without edges for prediction.

