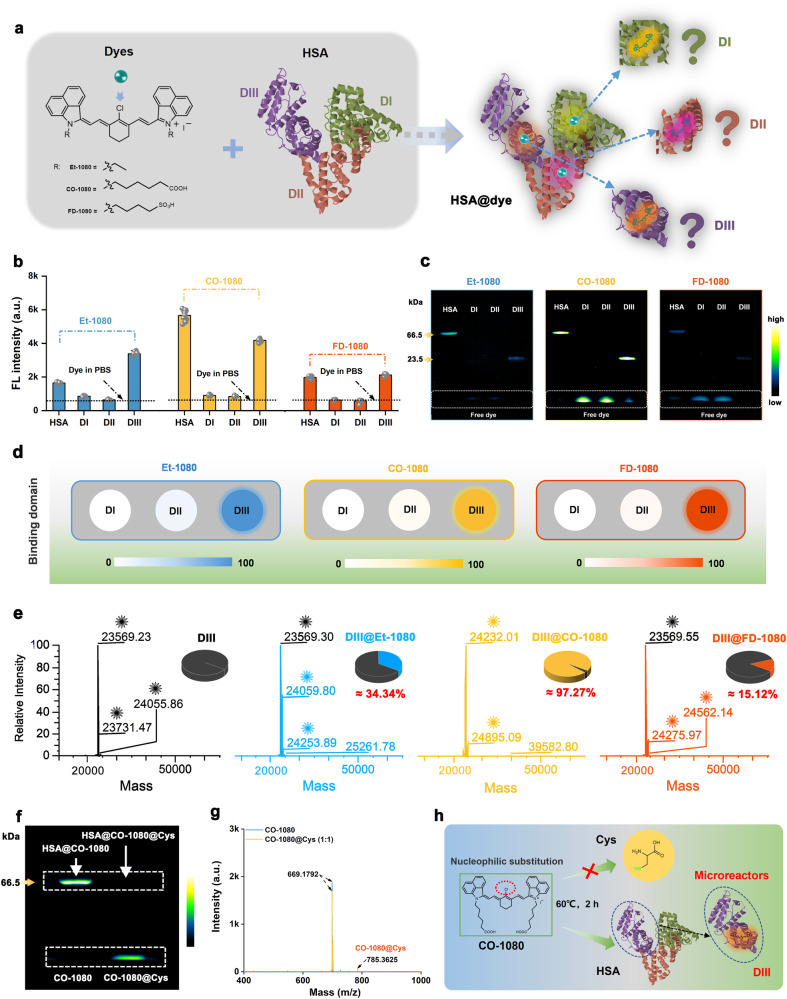
Fig. 3. Domain analysis of NIR-II chromophores binding to HSA.
a Schematic illustration of the binding domain between NIR-II chromophores and HSA. b Brightness (mean ± SD, n = 10 independent samples per group) and c gel electrophoresis analysis (n = 4 independent experiment) of the binding ability between Et-1080, CO-1080, FD-1080 chromophores and HSA, DI, DII, DIII. d Comparison of the covalent binding ability between three dyes and HSA, DI, DII, DIII. e High-resolution mass spectrometry of the DIII, DIII@Et-1080, DIII@CO-1080, and DIII@FD-1080. f Gel electrophoresis results of CO-1080 and CO-1080@Cys binding to HSA (n = 4 independent experiment). g Mass spectra of the CO-1080 and CO-1080@Cys obtained in a catalyst-free condition with a molar ratio of CO-1080 to Cys at 1:1(Cys: L-cysteine). h Reaction diagram showing CO-1080 with Cys and HSA (or DIII). Protein structures were generated by the Protein Data Bank (PDB). Source data are provided as a Source Data file.

