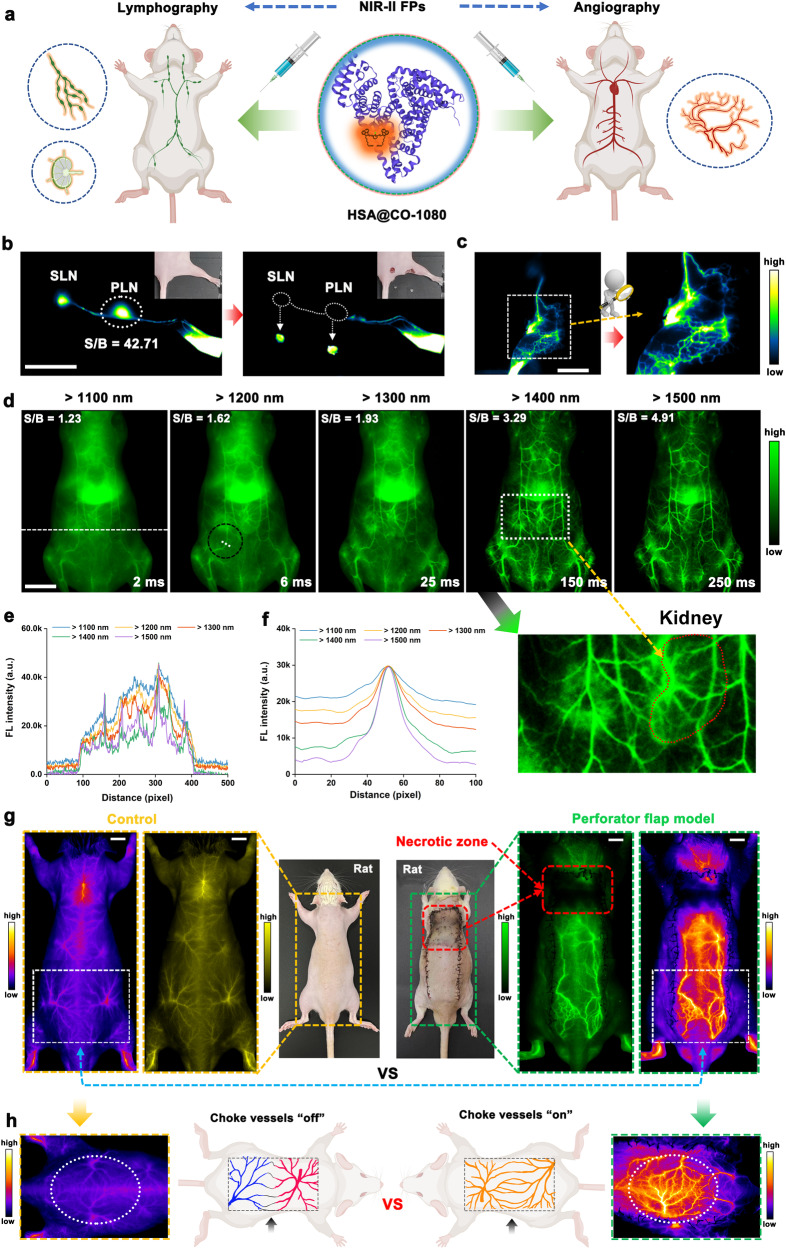
Fig. 5. High-performance NIR-II lymphography and angiography using HSA@CO-1080 FPs.
a Schematic of the HSA@CO-1080 FPs for NIR-II lymphography and angiography. b HSA@CO-1080 FPs-guided lymph node imaging and NIR-II-guided surgical excision (PLN: popliteal lymph node, SLN: sacral lymph node, S: signal, B: background, > 1200 nm collection, 100 ms, n = 3 independent mice). c NIR-II lymphedema imaging of HSA@CO-1080 FPs (> 1200 nm, 100 ms, n = 3 independent mice). d NIR-II whole-body vessel imaging of HSA@CO-1080 FPs under different sub-NIR-II windows (n = 3 independent mice). e, f Cross-sectional fluorescence signals profile of the NIR-II whole-body vessels imaging. g Comparison of the NIR-II angiography between normal rats and perforator flap model rats using HSA@CO-1080 FPs (n = 3 independent rats). h Comparison of the NIR-II choke vascular area imaging in rats before and after perforator flap modeling (> 1200 nm collection, 200 ms). The dosage of HSA@CO-1080 FPs was 600 μM (200 μL for mice and 1 mL for rats) for all imaging. For NIR-II lymphography, the HSA@CO-1080 FPs were injected into mice by intramuscular injection. For NIR-II angiography, the HSA@CO-1080 FPs were injected into mice via tail intravenous injection. All scale bar lengths represent 1 cm. Some schematic diagrams were designed using BioRender software. Source data are provided as a Source Data file.

