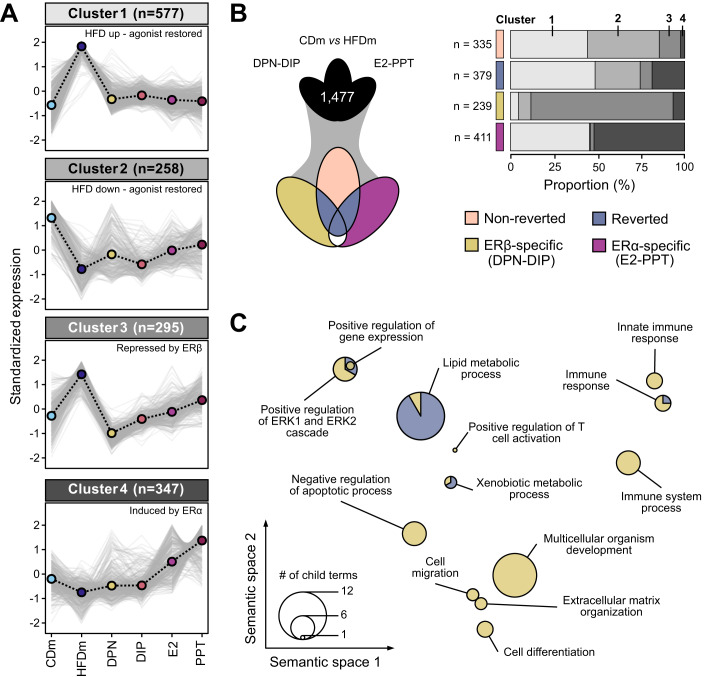
Figure 2. ERα/β-agonist treatment largely reverts HFD-induced transcriptome alterations in males.
(A) Line charts depict four clusters (gray-scaled) of gene expression trends (z-score) for unified deregulated genes (DEGs, n = 1477) in mice on different diets and ER-agonist treatments (color-coded, n = 4, except PPT: n = 3). Cluster centroid (dashed black line) represents all deregulated genes (gray lines). Number of genes per cluster is shown (parentheses). (B) Three-way Venn diagram (left) presents intersections of unified DEGs (clustered in (A)). Genes are categorized (right) into non-reverted (rose), reverted (denim), ERβ-specific (DPN-DIP, ocher) and ERα-specific (E2-PPT, violet) gene sets. Horizontal bar chart displays the proportional occurrences of gene sets in the four clusters (gray scale as in (A)). Number (n) indicates gene set size. (C) PCA factorial map separates the semantic space of enriched gene ontology (GO) terms in reverted and ERβ-specific gene sets (circles). Enriched GO terms are collapsed at the parent term level and separated based on similarity (x–y axis). Circle size corresponds to number of enriched GO terms. A hypergeometric test with Benjamini–Hochberg correction was used for the overrepresentation analysis.

