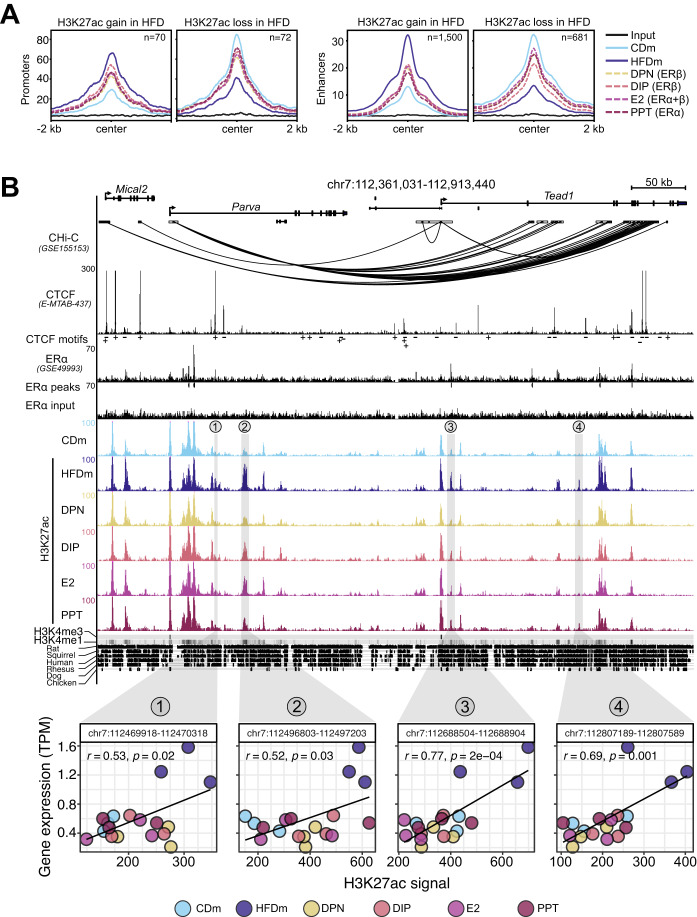
Figure 4. ERα/β-agonist treatment recovers HFD-induced changes at enhancers and promoters.
(A) Metaplots show H3K27ac read aggregation in promoters (left) and enhancers (right), centered at the peak summits. Number (n) indicates significant H3K27ac signal gains or losses in livers of HFDm compared to CDm. The average signal is depicted (n = 3 mice per condition). (B) Genome browser view (mm10) illustrates genomic region around the Tead1 gene locus. Black boxes represent exons and UTRs. Arrows indicate gene transcription directionality. The scale bar shows genomic region length in kilobases (kb). Black arcs display promoter-capture Hi-C (CHi-C) 3D connections. Genomic regions are enriched for CTCF (black peaks) with CTCF motif orientations determined with FIMO (plus or minus symbols), ERα (black peaks), ERα input (black peaks), significant ERα peaks (black insets), H3K27ac (color-coded peaks) in CDm, HFDm and ER-agonist-treated HFDm, H3K4me3, and H3K4me1 (horizontal gray bar; dark: high, light: low). One replicate per condition is shown. The y axis of each track specifies normalized read density. Genomic location of enhancers (numbered from 1 to 4) paired with the Tead1 gene locus are highlighted (gray vertical boxes). The degree of genomic sequence conservation in vertebrates is shown (conserved: black, not conserved: white). Scatter plots correlate Tead1 gene expression (TPM, y axis) and its paired enhancers (H3K27ac signal, x axis) in the livers of male mice on different diets and ER-agonist treatments. All three biological replicates are shown. Enhancer coordinates (400 bp window around the enhancer summit), Pearson correlation coefficients (r) and significance (p) are indicated in each box.

