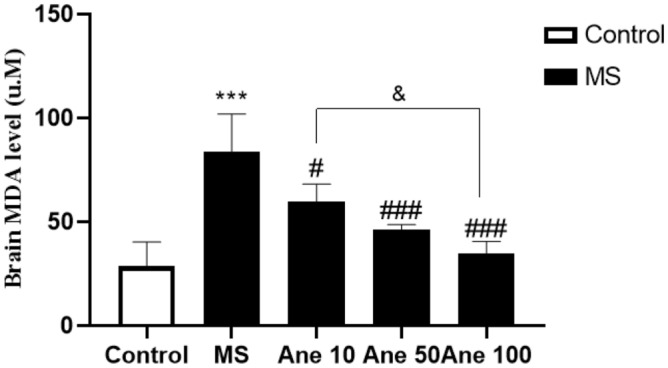
Figure 6.

The effect of anethole on MDA level. Control: group without MS receiving normal saline; MS: MS group receiving normal saline; Ane 10, Ane 50, Ane 100: MS group treatment with anethole at doses 10, 50 and 100 mg/kg. ***P < 0.001: comparison of MS group and control group; #P < 0.05,0###P < 0.001 and ###P < 0.001: comparison of MS group with MS group receiving anethole at doses 10, 50 and 100 mg/kg. &P < 0.05: comparison of group receiving anethole at a dose of 10 mg/kg with the group receiving anethole at a dose of 100 mg/kg.
