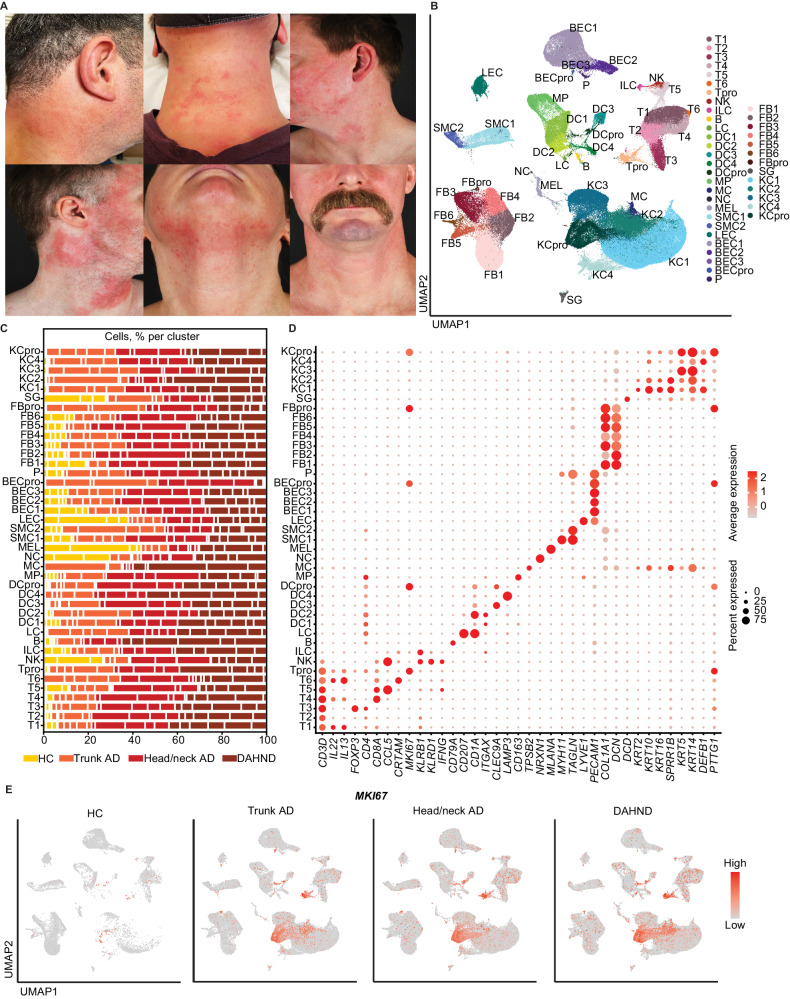
Fig. 1. scRNA-seq map of cells from DAHND, untreated head/neck AD and trunk AD, as well as HC samples.
A Clinical pictures of the 6 patients that were included in this study with de novo dupilumab-associated head and neck dermatitis (DAHND). B UMAP plot of unsupervised clustering of 196,040 cells integrated from DAHND (n = 6), untreated head/neck AD (n = 5), untreated trunk AD (n = 5) and HC samples (n = 4) according to similarity of transcriptome, resulting in 41 different color-coded clusters. C Relative distribution of samples per condition across cell clusters. D Dot plot displaying average gene expression and frequency of canonical cell type markers for each cluster. Circle size represents the percentage of cells expressing the specific marker within a cluster. Coloring denotes expression levels within each cluster (red is high). E Feature plots of disease groups showing the proliferation marker MKI67. Intensity of expression levels for each cell is color-coded (red) and overlaid onto UMAP plots. UMAP Uniform Manifold Approximation and Projection, T T-cells, NK NK cells, ILC innate lymphoid cells, B cells of the B cell lineage, LC Langerhans cells, DC dendritic cells, MP macrophages, MC mast cells, NC neuron cells, MEL melanocytes, SMC smooth muscle cells, LEC lymphatic endothelial cells, BEC blood endothelial cells, P pericytes, FB fibroblasts, SG sweat gland cells, KC keratinocytes; “pro” indicates proliferating subsets.

