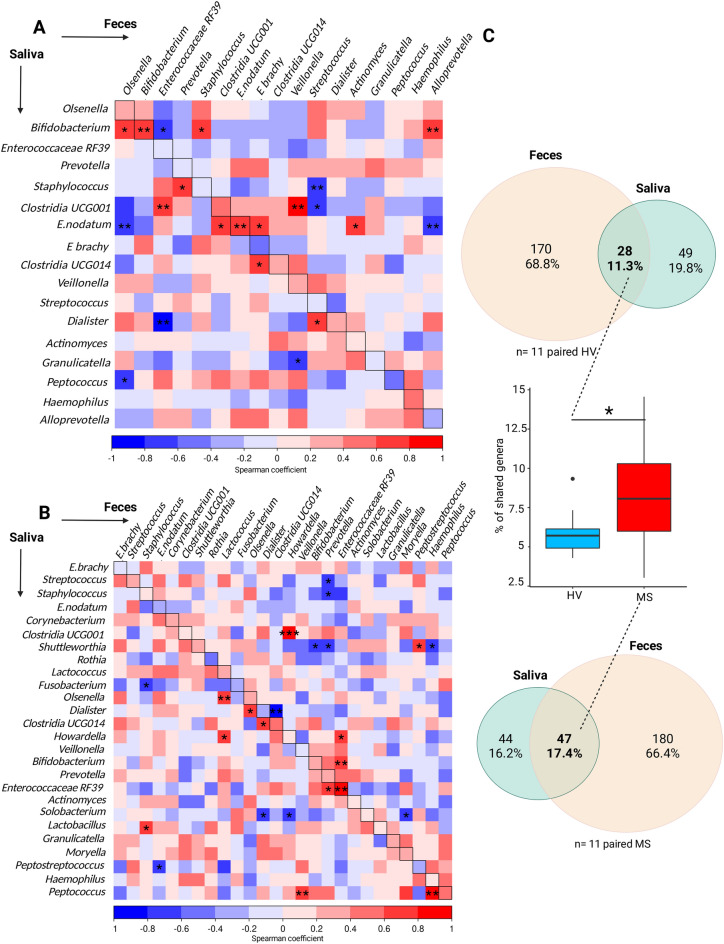
Figure 4.
Comparison of oral and faecal microbiome compositions. Spearman correlation coefficients were determined comparing the relative abundance of the oral versus faecal bacterial genera in the (A) HV and (B) RRMS samples. Red colour represents a positive association; blue represents a negative association. The horizontal axis represents the faecal composition and the vertical axis represents the oral composition. Statistically significant spearman correlations are indicated by stars: *p < 0.05, **p < 0.01. (C) The numbers of shared genera between oral and faecal flora in HV (upper Venn diagram) and in MS (lower Venn diagram). The middle boxplot represents the number of shared genera per individual.

