Figure 6.
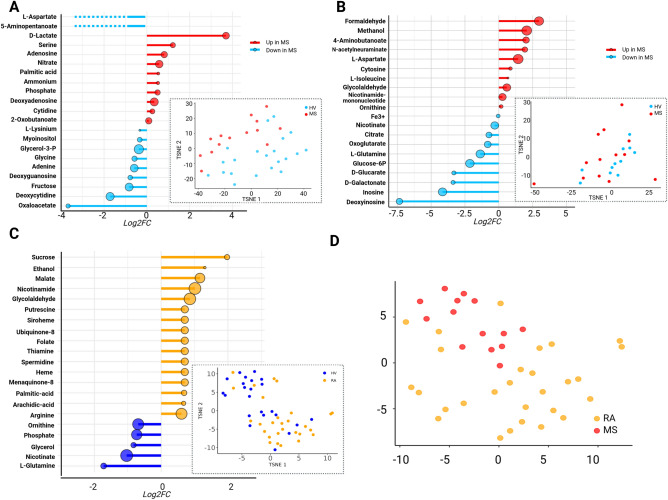
Predicted availability of microbiota-derived metabolites. Bacterial metabolism was reconstructed using FBA. For each individual 80–90% of their total microbiome was reconstituted. Circle size represents significance level. Dotted lines represent metabolites switches from production to consumption (blue dotted lines) (A,B) Significantly affected bioavailability of microbiota derived metabolites in MS and individual metabolite fluxes t-distributed stochastic neighbour embedding (t-SNE) projection in (A) Saliva, and (B) Faeces, expressed in log2 (Fold Change). (C) Significantly affected bioavailability of microbiota-derived metabolites in the saliva of RA and corresponding individual metabolite fluxes t-SNE projection. (D) Metabolism reconstruction for RA and MS were merged and the corresponding fluxes were projected on a t-SNE reduction. Results were considered significant using p < 0.05 and FDR < 0.1.

