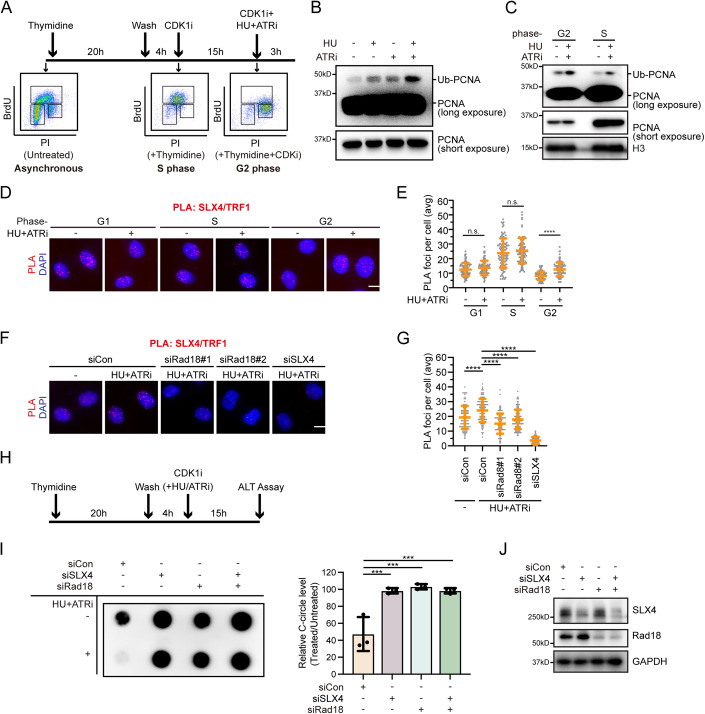
Figure 6. ATR inhibits excessive SLX4 accumulation at telomeres in ALT cells.
(A) Top: Schematic analysis of PCNA monoubiquitination in U2OS cells enriched in the S phase or G2 phase. For U2OS cells enriched in the S phase, cells were treated with thymidine for 20 h, released into DMEM for 4 h, and collected. For U2OS cells enriched in the G2 phase, cells were treated with thymidine for 20 h, released into DMEM for 4 h, and then treated with CDK1 inhibitor, 15 μM RO-3306, for 15 h. Bottom: BrdU incorporation and cell-cycle profiles of the tested cell populations. (B) ATR inhibits PCNA monoubiquitination in U2OS cells during the G2 Phase. U2OS cells synchronized in G2 were treated with a combination of 2 mM HU and 2 μM VE-821 or an equivalent volume of DMSO for 3 h. Chromatin fractions were isolated and immunoblotted with the indicated antibodies. (C) U2OS cells synchronized in the G2 phase or S phase were treated with a combination of 2 mM HU and 2 μM VE-821 or an equivalent volume of DMSO for 3 h. Chromatin fractions were isolated and immunoblotted with the indicated antibodies. (D, E) ATR limits excessive SLX4 accumulation at telomeres in U2OS Cells. For G1 phase enrichment, cells were treated with thymidine for 20 h. For S phase enrichment, cells were treated with thymidine for 20 h, and released into DMEM for 2 h. For G2 phase enrichment, cells were treated with thymidine for 20 h, released into DMEM for 4 h, and then treated with CDK1 inhibitor, 15 μM RO-3306, for 15 h. Subsequently, U2OS cells enriched in each phase were either mock-treated or treated with 2 mM HU and 2 μM VE-821 for 3 h, followed by PLA using anti-SLX4 and anti-TRF1 antibodies. Representative images of PLA foci (D). Scale bar, 10 μm. Quantification of PLA foci number per focus-positive cell (E). Data represent means ± SD of three independent experiments. More than 100 cells were counted for each sample. n.s. indicates not significant, ****P < 0.0001, one-way ANOVA test. (F, G) U2OS cells were transfected with the indicated siRNAs. Twenty-four hours after transfection, cells were synchronized in the G2 phase, mock-treated or treated with 2 mM HU and 2 μM VE-821 for 3 h, and then subjected to PLA using anti-SLX4 and anti-TRF1 antibodies. Representative images of PLA foci (F). Scale bar, 10 μm. Quantification of PLA foci number per focus-positive cell (G). Data represent means ± SD of three independent experiments. More than 100 cells were counted for each sample. ****P < 0.0001, one-way ANOVA test. (H) Schematic analysis of the effects of ATR inhibition on ALT activity. U2OS cells were treated with thymidine for 20 h, released into DMEM for 4 h, and then treated with CDK1 inhibitor RO-3306 (15 μM) in combination with HU (50 μM) and VE-821 (500 nM). After 15 h of drug treatment, cells were collected for the C-circle assay. (I) Left: A representative dot blot for telomeric C-circle assay showing levels of telomeric C-circles in U2OS cells, either mock-treated or treated with HU+ATRi. Right: C-circle levels are quantified as percentages relative to those in mock-treated cells. Data represent means ± SD of three independent experiments. ***P < 0.001, one-way ANOVA test. (J) Western blot analysis of knockdown efficiency of Rad18 and SLX4. Source data are available online for this figure.

