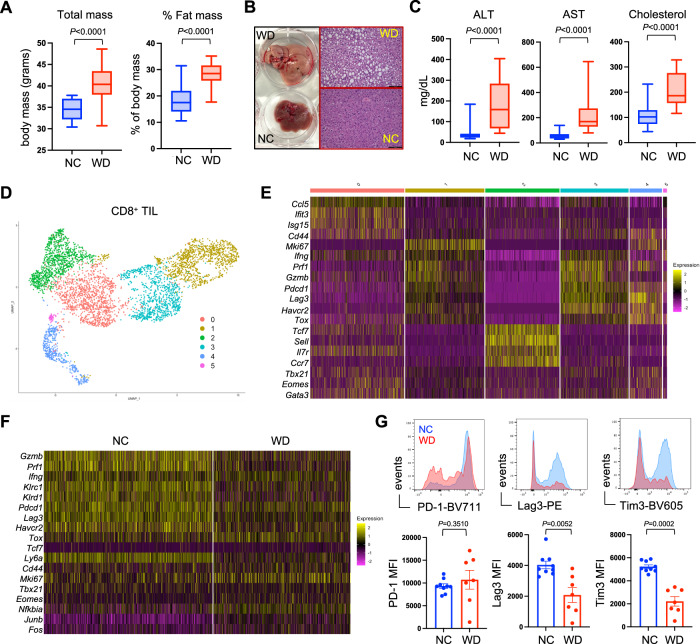
Fig. 1. CD8+ T cell dysfunction in the obese tumor microenvironment.
Mice were placed on either normal chow (NC) or western diet (WD) for 12 weeks. A Body mass (NC n = 20, WD n = 20) and fat mass (NC n = 30, WD n = 30), B liver histology, C serum liver enzymes alanine aminotransferase (ALT) and aspartate aminotransferase (AST), and cholesterol were measured (NC n = 10, WD n = 20). D Unsupervised UMAP clustering of scRNAseq data from CD8+ TIL sorted from day 14 established B16 tumors. E Relative expression of cluster-defining genes for each of the 6 clusters were identified. F Differential gene expression within TIL clusters 1 and 3 from mice on NC versus WD. G FACS analysis of CD8+ TIL from mice on NC (blue) or WD (red) showing surface protein expression of PD-1, Lag3, and Tim3 (NC n = 9, WD n = 7). Graphs display pooled data from 2 independent experiments. For all bar graphs, each point represents an individual mouse with SEM indicated by the error bars. All box-and-whisker plots: The box indicates the 25th and 75th percentile, the line indicates the data median, and the whiskers indicate the minimum and maximum of all individual values. All n’s represent an individual mouse. Exact P values were calculated by two-sided Mann–Whitney U test.

