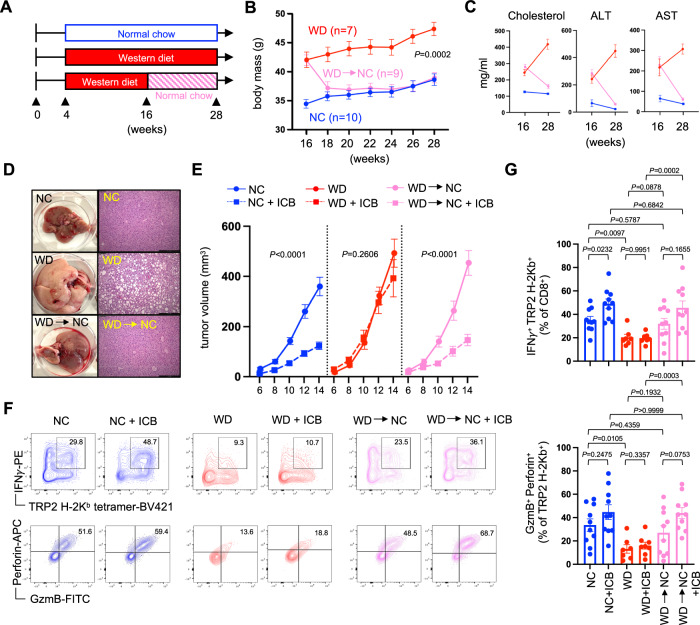
Fig. 2. Diet-induced weight loss rescues CD8+ TIL effector function.
Mice were placed on either normal chow (NC) or western diet (WD) for 12 weeks. A At that time, a cohort of mice on WD was switched to NC (WD→NC) and all mice were maintained for an additional 12 weeks. B Body mass was tracked over this time and graphed data is from a representative experiment showing the average mass of all mice in each group with SEM indicated by the error bars. C Serum cholesterol, alanine aminotransferase (ALT), and aspartate aminotransferase (AST) levels were assessed at week 16 (NC n = 6, WD n = 12, WD→NC n = 12), prior to diet switching, and at week 28 (all groups n = 10). D Liver histology was assessed at week 28. At week 28, mice received a subcutaneous injection of B16 tumor cells in the flank (day 0) and half of each cohort was treated with immune checkpoint blockade (ICB; anti-PD-1/anti-CTLA-4) or PBS vehicle control on days 6 and 10. E Tumor volumes were measured every other day starting at day 6 (NC n = 20, NC + ICB n = 20, WD n = 18, WD + ICB n = 20, WD→NC n = 20, WD→NC + ICB n = 20). F Tumors were harvested at day 15 and representative FACS plots show intracellular IFNγ, GzmB and Perforin expression by TRP-2-specific CD8+ TIL. G Graphs display pooled data from 2 independent experiments showing the percent of CD8+ TIL that are specific for TRP-2 and produce IFNγ (upper), and the percent of TRP-2-specific CD8+ TIL co-expressing GzmB and Perforin (lower) (NC n = 10, NC + ICB n = 10, WD n = 7, WD + ICB n = 8, WD→NC n = 10, WD→NC + ICB n = 10). For all bar graphs, each point represents an individual mouse with SEM indicated by the error bars. Exact P values were calculated by two-sided Mann–Whitney U test.

