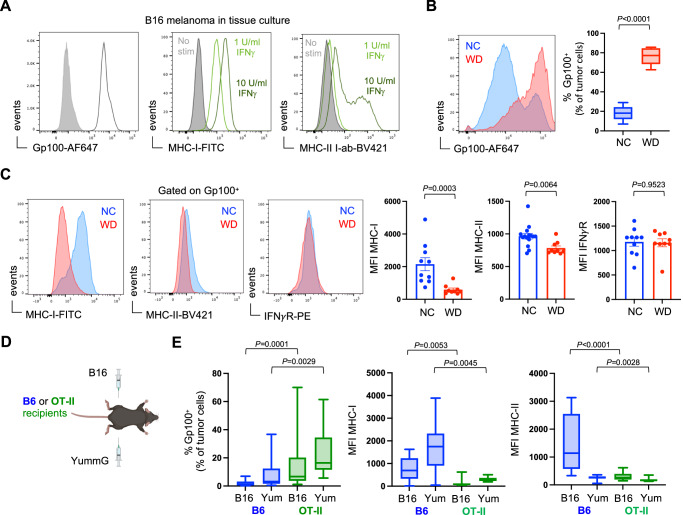
Fig. 4. Altered tumor immunoediting in obese hosts.
B16 melanoma tumor cells were grown and harvested from cell culture. A Baseline expression of intracellular Gp100, surface MHC-I, and surface MHC-II was assessed via flow cytometry. MHC-I and MHC-II expression was also analyzed after 24-h in vitro stimulation with recombinant murine IFNγ. Subcutaneous B16 tumors were harvested on day 14 and tumor cells were assessed for expression of intracellular Gp100 by flow cytometry. B Representative FACS plots show Gp100 expression by B16 cells from mice on normal chow (NC; blue) and western diet (WD; red), and pooled median fluorescence intensity (MFI) data from 2 independent experiments is graphed (NC n = 15, WD n = 9). C Representative FACS plot and pooled MFI data from 2 independent experiments is graphed showing MHC-I (NC n = 10, WD n = 9), MHC-II (NC n = 15, WD n = 9), and IFNγ receptor (IFNγR) (NC n = 10, WD n = 9) expression on Gp100+ tumor cells. D Bi-lateral subcutaneous B16 and YummG melanoma tumors were established in lean B6 and OT-II mice. Tumors were harvested on day 14 and expression of Gp100 and MHC-I/II was measured by flow cytometry (All groups n = 12 mice). E Graphs display pooled data from 2 independent experiments. For all bar graphs, each point represents an individual mouse with SEM indicated by the error bars. All box-and-whisker plots: The box indicates the 25th and 75th percentile, the line indicates the data median, and the whiskers indicate the minimum and maximum of all individual values. All n’s represent an individual mouse. Exact P values were calculated by two-sided Mann–Whitney U test.

