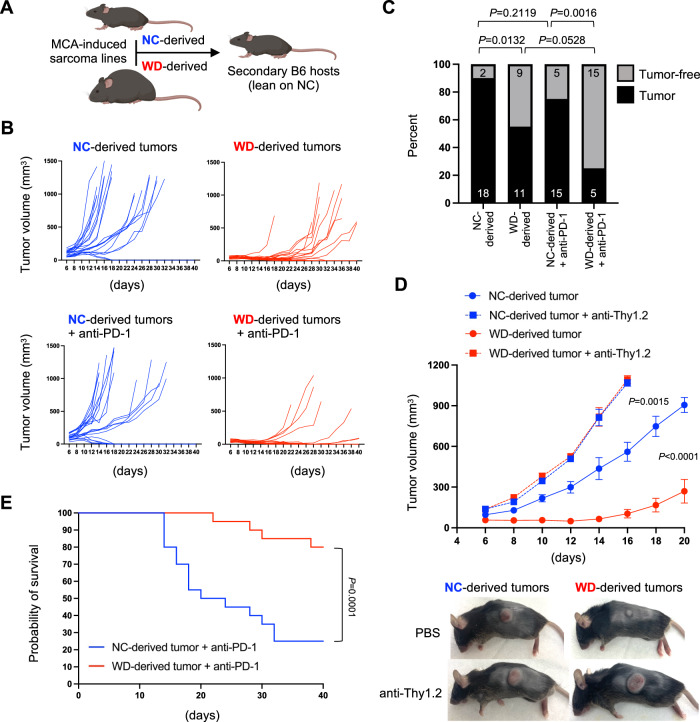
Fig. 6. Altered tumor immunogenicity in obese hosts.
MCA-induced tumors were harvested from wildtype mice in Fig. 5. A Sarcoma cell lines were generated from 4 mice on normal chow (NC) and 4 mice on western diet (WD) for reimplantation into secondary lean recipients. B Each NC-derived and WD-derived sarcoma cell line was injected subcutaneously into the flank of 10 secondary recipients, with half of each cohort receiving immune checkpoint blockade (ICB; 5 mg/kg anti-PD-1) or PBS on days 7 and 14. Mice were monitored for tumor growth for 40 days. C The percent and number (inset) of mice with NC-derived and WD-derived sarcoma cell lines that developed a tumor of at least 500 mm3 is shown with exact P values indicated for the bracketed groups calculated by two-sided Chi-squared analysis. D NC-derived and WD-derived sarcoma cell lines were injected subcutaneously into the flank of 10 secondary recipients, with half of each cohort depleted of T cells via injection with anti-Thy1.2 on days −1, 1, and 7. Tumor volume was tracked for 20 days and representative images of subcutaneous tumors are shown (all groups n = 10). P values were calculated by two-sided Mann–Whitney U test of tumor volumes at the day of euthanasia. E Survival of mice from B after anti-PD-1 treatment is displayed in a Kaplan–Meier graph with exact P value calculated via log-rank. A Created using BioRender.com.

