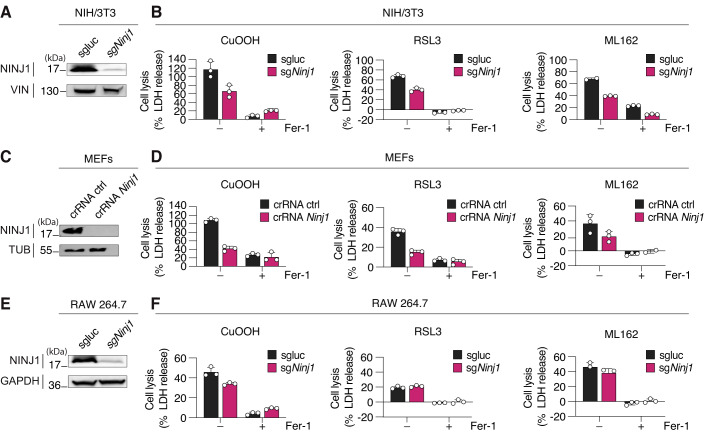
Figure 3. NINJ1 controls LDH release from ferroptotic fibroblast and partially from RAW 264.7 cells.
(A) Western blot analysis of NINJ1 expression in (sgluc) and Ninj1 knockout (sgNinj1) NIH/3T3. (B) LDH release in WT (sgluc) and Ninj1 knockout (sgNinj1) NIH/3T3 after treatment with 1 mM CuOOH for 5 h, 5 μM RSL3 for 8 h, or 5 μM ML162 for 8 h. (C) Western blot analysis of NINJ1 expression in WT (crRNA ctrl) and Ninj1 knockout (crRNA Ninj1) MEFs. (D) LDH release in WT (crRNA ctrl) and Ninj1 knockout (crRNA Ninj1) MEFs after treatment with 0.4 mM CuOOH for 5 h, 5 μM RSL3 for 8 h, or ML162 5 μM for 8 h. (E) Western blot analysis of NINJ1 expression in WT (sgluc) and Ninj1 knockout (sgNinj1) RAW 264.7. (F) LDH release in WT (sgluc) and Ninj1 knockout (sgNinj1) RAW 264.7 after treatment with 1 mM CuOOH for 2 h, 5 μM RSL3 for 3 h, or 5 μM ML162 for 2 h. Cells were lentivirally transduced with Cas9 and a sgRNA targeting luciferase (sgluc) or crRNA (crRNA ctrl), used as controls, or NINJ1 (sgNinj1 and crRNA Ninj1). Cell extracts were analyzed (A, C, E). Vinculin (VIN), Tubulin (TUB), or GAPDH are loading controls. When indicated, 25 μM Fer-1 was added simultaneously with ferroptosis activators (B, D, F). Data information: All graphs show the mean ± SD. Data are representative of three independent experiments performed in triplicate. Source data are available online for this figure.

