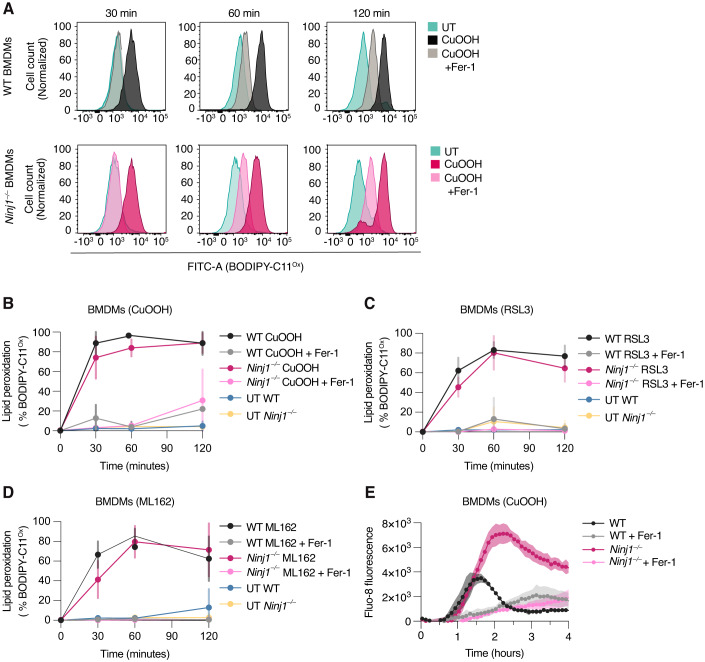
Figure 4. NINJ1 is activated downstream of lipid peroxidation and Ca2+ influx in BMDMs.
(A) Representative analysis of BODIPY 581/591 C11 fluorescence at 540 nm emission wavelength (oxidized form, BODIPY-C11Ox). Histograms show normalized cell counts in WT and Ninj1−/− BMDMs left untreated or after treatment with 1 mM CuOOH for 30, 60, or 120 min. (B) Quantification of (A) with additional replicates included. Percentage of WT and Ninj1−/− BMDMs positive for BODIPY-C11Ox in untreated cells (UT) or after treatment with 1 mM CuOOH for 30, 60, or 120 min. (C) Percentage of WT and Ninj1−/− BMDMs positive for BODIPY-C11Ox in untreated cells (UT) or after treatment with 5 μM RSL3 for 30, 60, or 120 min. (D) Percentage of WT and Ninj1−/− BMDMs positive for BODIPY-C11Ox in untreated cells (UT) or after treatment with 5 μM ML162 for 30, 60, or 120 min. (E) Time course analysis from 0–4 h of Fluo-8 (intracellular Ca2+ probe) fluorescence signal in WT and Ninj1−/− BMDMs treated with 1 mM CuOOH. When indicated, 25 μM Fer-1 was added simultaneously with ferroptosis activators (A–E). Data information: Graphs show the mean ± SD. Histograms show cell counts normalized to mode. Data are representative of three independent experiments performed in triplicate (A, E) or pooled from three independent experiments performed in triplicate (B–D). Source data are available online for this figure.

