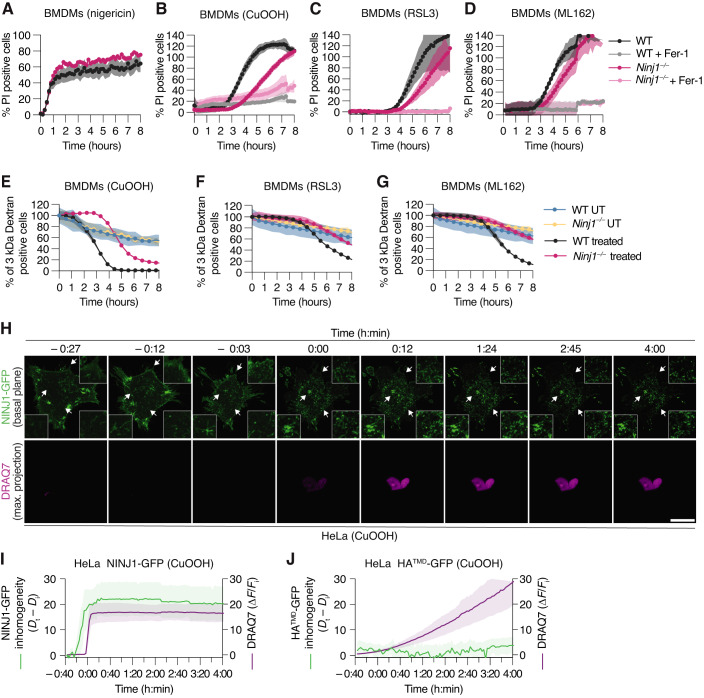
Figure 5. NINJ1 controls plasma membrane permeabilization during ferroptosis in macrophages and fibroblasts.
(A–D) Percentage of propidium iodide (PI, Mw = 668 Da) uptake in WT and Ninj1−/− BMDMs over time (0–8 h) after treatment with 5μg/mL nigericin (A), 1 mM CuOOH (B), 5 μM RSL3 (C), or 5 μM ML162 (D). When indicated, 25 μM Fer-1 was added simultaneously with ferroptosis activators. (E–G) Release of 3 kDa fluorescent dextran from WT and Ninj1−/− BMDMs left untreated (UT) or treated with 1 mM CuOOH (E), 5 μM RSL3 (F), or 5 μM ML162 (G) over time (0–8 h). (H) Time-lapse fluorescence confocal microscopy of HeLa cells expressing hNINJ1-GFP after 1 mM CuOOH treatment. Images show the green fluorescence at the basal plane of the cell and the influx of DRAQ7 (maximum projection from a Z-stack) to track plasma membrane permeabilization. White arrows indicate regions that are enlarged in the insets. Time was normalized to the onset of increase in DRAQ7 nuclear fluorescence. Scale bar: 20 µm. (I, J) Normalized quantification of the inhomogeneity distribution of NINJ1-GFP (I) or HATMD-GFP (J) at the basal plane of cells, and DRAQ7 nuclear fluorescence intensity after 1 mM CuOOH treatment over time. The inhomogeneity distribution at each time point (Dt) was normalized to the distribution inhomogeneity at the initial time point of the experiment (Di). Data information: All graphs show the mean ± SD. Data are representative of two (A, E) or three (F, G) independent experiments performed in triplicate, representative of 8 independent experiments (H), or pooled from two independent experiments performed in triplicate (B–D) or 8 (I) or 6 (J) independent experiments. Source data are available online for this figure.

