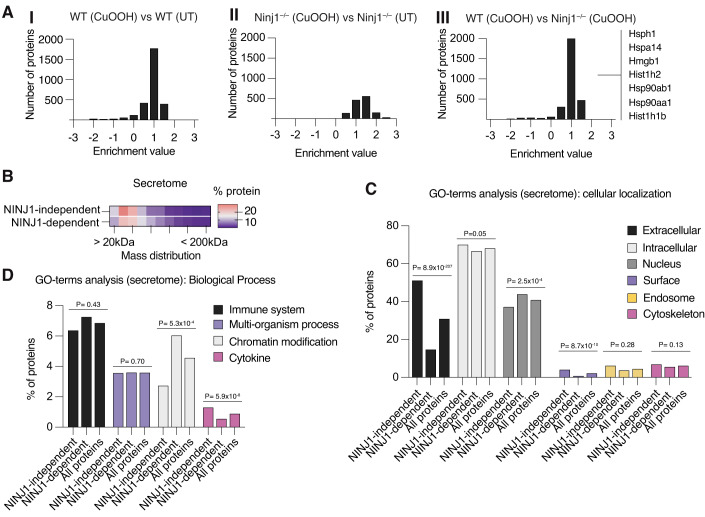
Figure 6. NINJ1 controls the release of DAMPs from ferroptotic cells.
(A) SILAC enrichment distributions, comparing: WT iBMDMs treated with 1 mM CuOOH to untreated (UT) (A I), Ninj1−/− iBMDMs treated with 1 mM CuOOH to untreated (UT) (A II), and WT iBMDMs treated with 1 mM CuOOH to Ninj1−/− iBMDMs treated with 1 mM CuOOH (A III). CuOOH treatment for 2 h. Selected DAMPs released in a NINJ1-dependent manner upon ferroptosis induction are indicated (full list in Dataset EV1). (B) Heatmap depicting the distribution of protein sizes detected with a logarithmic enrichment larger than 0.5 in WT and Ninj1−/− iBMDMs treated with 1 mM CuOOH for 2 h. Bin centers were chosen in 20 kDa increments, ranging from 10 kDa (i.e., 0 to 20 kDa) to 210 kDa (i.e., larger than 200 kDa). (C, D) Cellular Localization (C) and Biological Process (D) GO-term analyses of the NINJ1-dependent (WT iBMDMs) and NINJ1-independent (Ninj1−/− iBMDMs) ferroptotic secretome from iBMDMs treated with 1 mM CuOOH for 2 h. Bars depict the percentage of proteins that are annotated with a given GO-term among all proteins identified in the sample. Data information: p-values were calculated by Chi-square test, assuming an even distribution. Data are pooled from two independent experiments (A–D), requiring presence of a given protein in both datasets to ensure reliability.

