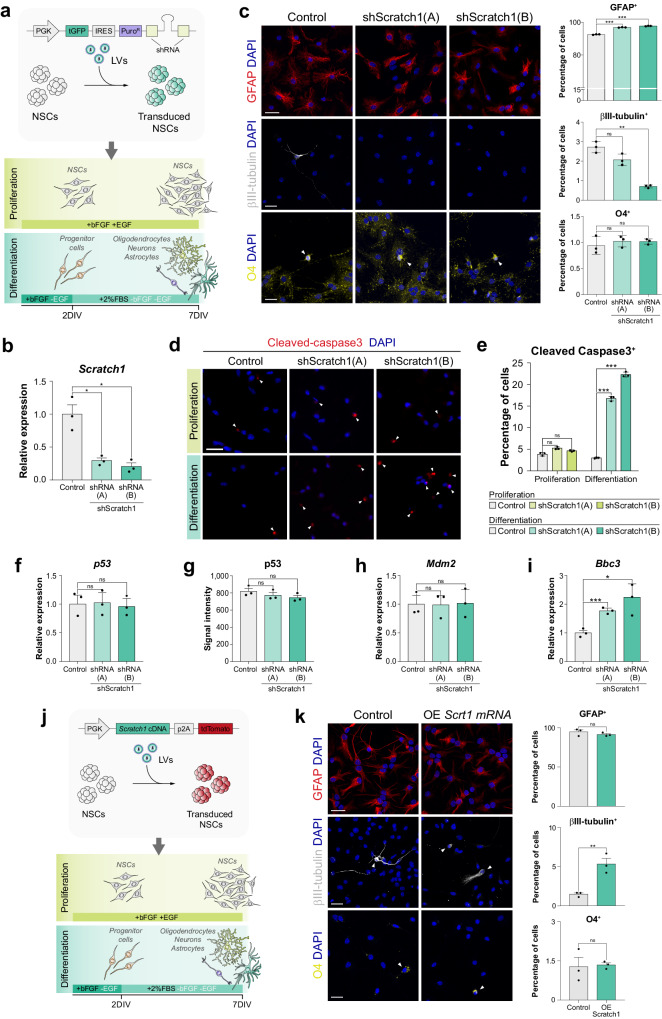
Fig. 2. Scratch1 promotes the survival of the differentiating cells and their terminal differentiation into neuros.
a Schematic representation of the transduction of NSCs with lentiviruses (LV) and the construct used for Scratch1 loss of function experiments. Transduced NSCs were subsequently cultured either in proliferation or differentiation conditions. b Analysis of efficiency of the two independent Scratch1 shRNAs by qPCR 2 days after the induction of NSC differentiation (2DIV; p-value(shA) = 0.018, p-value(shB) = 0.016, n = 3 biologically independent samples, by two-tailed Student’s t-test). c Immunodetection and quantification of GFAP+ (red; p-value(shA) = 0.00006, p-value(shB) = 0.00005, n = 3 biologically independent samples, by two-tailed Student’s t-test), βIII-tubulin+ (white; p-value(shA) = 0.19, p-value(shB) = 0.002, n = 3 biologically independent samples, by two-tailed Student’s t-test) and O4+ (yellow; p-value(shA) = 0.70, p-value(shB) = 0.69, n = 3 biologically independent samples, by two-tailed Student’s t-test) cells in differentiating cultures previously infected with control or shScratch1 lentiviruses 7 days after the induction of differentiation (7DIV). d Immunodetection of cleaved-caspase3 (red) in cultures of adult NSCs 2 days after plating the cells (2DIV), both in proliferation and differentiation conditions. e Quantification of the percentage of cleaved-caspase3+ cells in cultures infected with control or shScratch1 lentiviruses, both in proliferation and differentiation conditions (proliferation: p-value(shA) = 0.054, p-value(shB) = 0.182, differentiation: p-value(shA) = 0.00002, p-value(shB) = 0.00001, n = 3 biologically independent samples, by two-tailed Student’s t-test). f Relative mRNA levels of p53 in RNA extracts obtained 2 days after the induction of differentiation (2DIV; p-value(shA) = 0.50, p-value(shB) = 0.99, n = 3 biologically independent samples, by two-tailed Student’s t-test). g Quantification of signal intensity for p53 immunofluorescence in NSCs fixed 2 days after the induction of differentiation (2DIV; p-value(shA) = 0.39, p-value(shB) = 0.16, n = 3 biologically independent samples, by two-tailed Student’s t-test). Relative mRNA levels of (h) Mdm2 (p-value(shA) = 0.85, p value(shB) = 0.46, n = 3 biologically independent samples, by two-tailed Student’s t-test) and (i) Bbc3 (p-value(shA) = 0.0008, p-value(shB) = 0.0244, n = 3 biologically independent samples, by two-tailed Student’s t-test) relative to TBP in RNA extracts obtained 2 days after the induction of differentiation (2DIV). j Schematic drawing representing the transduction of NSCs with lentiviruses (LV) and the construct used for Scratch1 overexpression experiments. Transduced NSCs were subsequently cultured either in proliferation or differentiation conditions. k Immunodetection and quantification of GFAP+ (red; p-value = 0.322, n = 3 biologically independent samples, by two-tailed Student’s t-test), βIII-tubulin+ (white; p-value = 0.0065, n = 3 biologically independent samples, by two-tailed Student’s t-test) and O4+ (yellow; p-value = 0.863, n = 3 biologically independent samples, by two-tailed Student’s t-test) cells in control or Scratch1 overexpressing NSC cultures 7 days after the induction of differentiation (7DIV). Arrowheads point to positive cells. Scale bars represent 25 µm. Data are presented as mean values ± SEM. ns not significant; *p < 0.05, **p < 0.01, ***p < 0.001. Source data are provided as a Source Data file.

