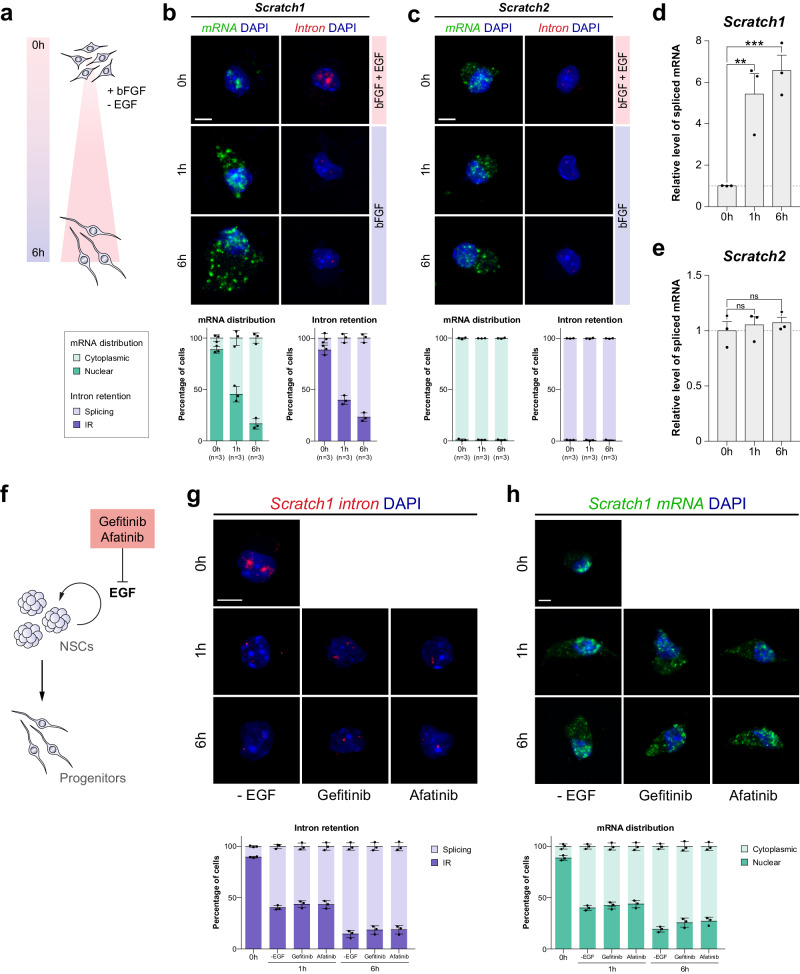
Fig. 4. Scratch1 mRNA is spliced and exported in NSCs in response to the differentiation signal.
a Schematic representation of the protocol used to induce the differentiation of NSCs in culture. b In situ hybridisation for Scratch1 mRNA (green) and Scratch1 intron (red) in NSCs at 0 h, 1 h and 6 h after the induction of differentiation. Quantification of mRNA distribution and intron retention (n = 3 mice). c In situ hybridisation for Scratch2 mRNA (green) and Scratch2 intron (red) in NSCs at 0 h, 1 h and 6 h after the induction of differentiation. Quantification of mRNA distribution and intron retention (n = 3 mice). d Ratio of spliced Scratch1 mRNA in NSCs at 0 h, 1 h and 6 h after the induction of differentiation (p-value(1 h) = 0.010, p-value(6 h)=0.001, n = 3 mice, by two-tailed Student’s t-test). e Ratio of spliced Scratch2 mRNA in NSCs at 0 h, 1 h and 6 h after the induction of differentiation (p-value(1 h)=0.824, p-value(6 h) = 0.370, n = 3 mice, by two-tailed Student’s t-test). f Schematic representation of the alternative protocol used to induce neural differentiation, the treatment of NSCs with EGF inhibitors. g In situ hybridisation for Scratch1 intron (red) in NSCs at 0 h, 1 h and 6 h after the induction of differentiation (left) or treatment with Gefitinib (center) or Afatinib (right). Quantification of intron retention (n = 3 mice). h In situ hybridisation for Scratch1 mRNA (green) in NSCs at 0 h, 1 h and 6 h after the induction of differentiation (left) or treatment with Gefitinib (center) or Afatinib (right). Quantification of mRNA distribution (n = 3 mice). Scale bars represent 5 µm. Data are presented as mean values ± SEM. ns not significant; *p < 0.05, **p < 0.01, ***p < 0.001. Source data are provided as a Source Data file.

