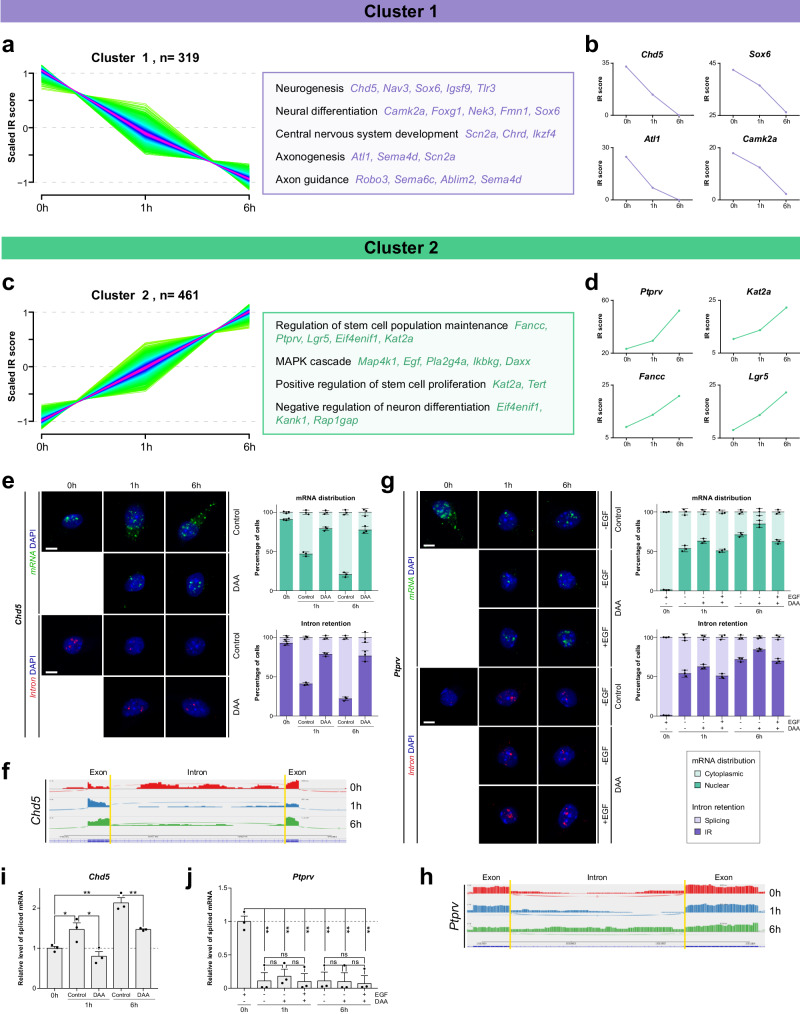
Fig. 7. Intron detention regulates the subcellular localisation of multiple transcripts to control the balance between stemness and differentiation during adult neurogenesis.
a Plot illustrating time point-specific changes in intron detention for genes belonging to Cluster 1 (left) and representative Gene Ontology (GO) terms of the biological process categories enriched in this cluster (right). b Intron retention score for genes representative of Cluster 1: Chd5, Sox6, Atl1 and Camk2a. c Plot illustrating time point-specific changes in intron detention for genes belonging to Cluster 2 (left) and representative Gene Ontology (GO) terms of the biological process categories enriched in this cluster (right). d Intron retention score for genes representative of Cluster 2: Kat2a, Lgr5, Fancc and Ptprv. e In situ hybridisation for Chd5 mRNA (green) or intron (red) in control or NSCs treated with DAA, taken as an example of a Cluster 1 gene. Quantification of mRNA distribution and intron retention (n = 3 biologically independent samples). f Sashimi plots depicting read density and number of splice junctions for Chd5 (Cluster 1) at different time points of the differentiation process, showing differential intron detention, which decreases with differentiation. g In situ hybridisation for Ptprv mRNA (green) or intron (red) in control NSCs and in NSCs treated with DAA, as an example of a gene from Cluster 2. Quantification of mRNA distribution and intron retention (n = 3 biologically independent samples). h Sashimi plots depicting read density and number of splice junctions for Ptprv (Cluster 2) at different time points of the differentiation process, showing an increase in intron detention with differentiation. i Ratio of spliced Chd5 mRNA in control and DAA-treated NSCs at 0 h, 1 h and 6 h after the induction of differentiation (control: p-value(1 h) = 0.05, p-value(6 h) = 0.0012, DAA: p-value(1 h) = 0.036, p-value(6 h) = 0.008, n = 3 biologically independent samples, by two-tailed Student’s t-test). j Ratio of spliced Ptprv mRNA in control and DAA-treated NSCs at 0 h, 1 h and 6 h after the induction of differentiation (-EGF: p-value(1 h, C) = 0.0029, p-value(1 h, DAA) = 0.0034, p-value(6 h, C) = 0.0026, p-value(6 h, DAA) = 0.0029, +EGF: p-value(1 h) = 0.0028, p-value(6 h) = 0.0018, n = 3 biologically independent samples, by two-tailed Student’s t-test). Scale bars represent 5 µm. Data are presented as mean values ± SEM. ns not significant; *p < 0.05, **p < 0.01, ***p < 0.001. Source data are provided as a Source Data file.

