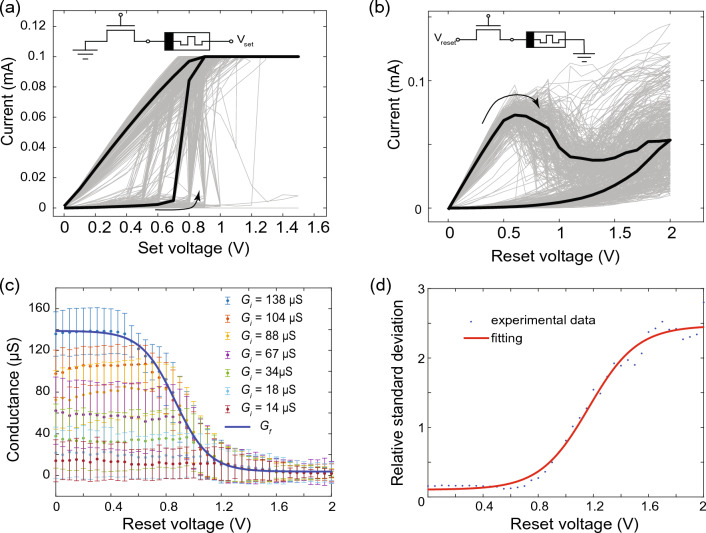
Figure 2.
Memristive device characteristics. Current-voltage (I–V) curves of used memristive devices (gray) and median curve (black). (a) The setting of the device to a low resistant state and (b) resetting to its high resistant state. Insets: measurements schematic of the used CMOS-integrated HfO2-based memristive devices which are organized in a 1T-1R cell within a 64 64 memory array. (c) Final conductance dependence on pruning voltage (dots) and fitting curve (blue line) which describes the reset process. For the reset voltage pulse different voltage amplitudes and a constant pulse width of have been used. Experimental conductance is obtained by applying the voltage pulse to the memristor with the initial conductance . (d) The relative standard deviation of final state on voltage: experiment (blue dots) and fitting (red line)).

