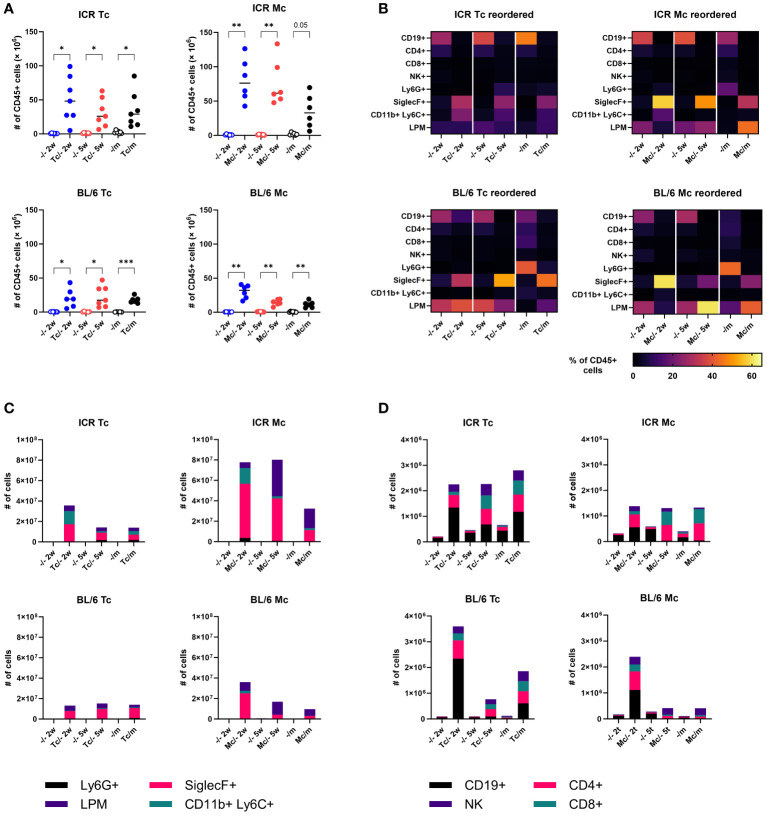
Figure 6.
Host immune response in the peritoneal cavity of mice. (A) Total numbers of leukocytes. Dots represent data from individual mice (n = 7); group medians are shown. (B) Heat maps showing the frequency of major leukocyte populations. (C, D) Total cell counts of major myeloid (C) and lymphoid (D) populations. Medians are shown; error bars are omitted to keep legibility. CD19+, B cells; CD4+, T helper cells; CD8+, cytotoxic T cells; NK+, natural killer cells; Ly6G+, neutrophils; SiglecF+, eosinophils; CD11b+Ly6C+, monocytes; LPM, large peritoneal macrophages. One-way ANOVA with Šíďák post-hoc test was used to analyze the data. * (p ≤ 0.05), ** (p ≤ 0.01), *** (p ≤ 0.001).

