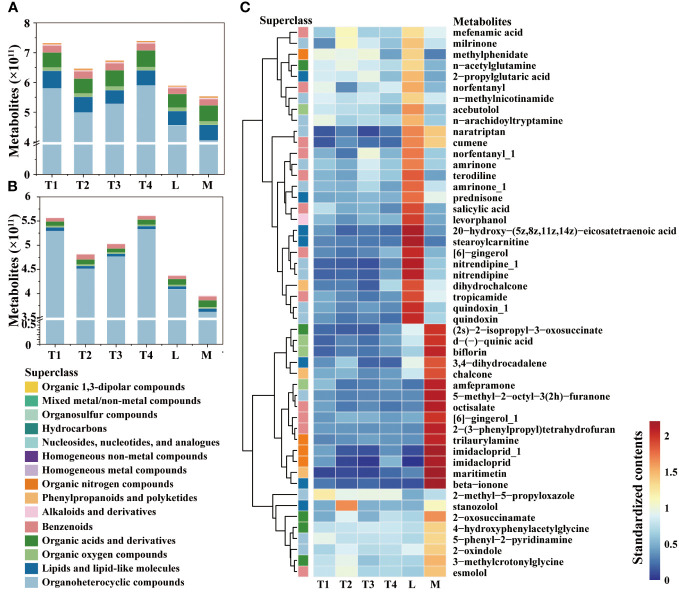
Figure 1.
Comparison of metabolites in different fermentation groups. (A) The contents of metabolites among six groups. (B) The contents of metabolites showed significant differences among the six groups. (C) Heatmap and hierarchical cluster analysis based on the contents of metabolites with the top 50 variable importance in projection (VIP).

