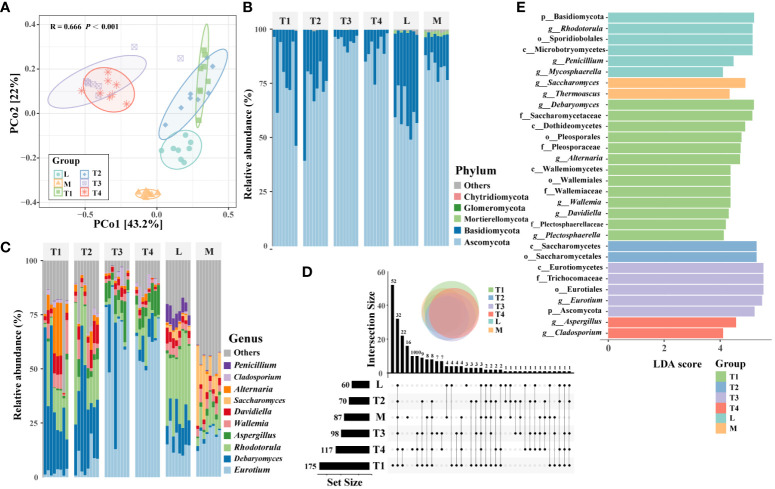
Figure 2.
Fungal community composition and distribution traits in six fermentation groups. (A) PcoA showing the Bray–Curtis similarities of plant leaf fungal communities. (B) An upset diagram illustrating the numbers of shared and unique OTUs among six fermentation groups. The composition of fungal communities in terms of phyla (C) and major genera (D) among six groups. (E) The fungal taxa were identified as biomarkers in six fermentation groups by LEfSe (LDA < 4, p < 0.05).

