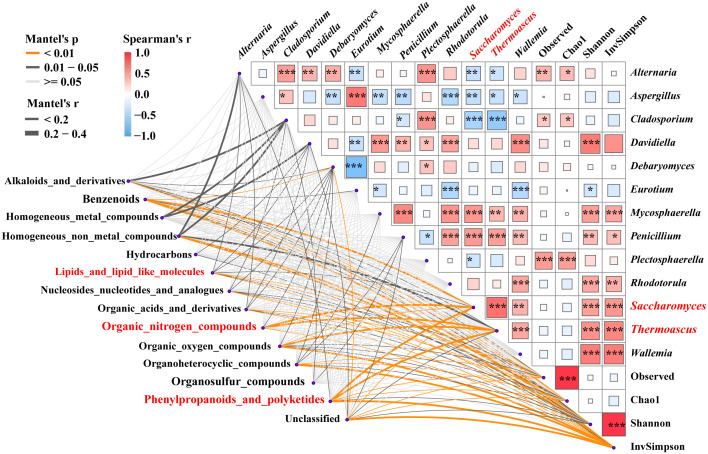
Figure 4.
Correlations between metabolites and associated fungal diversity and keystones. Pairwise Spearman’s correlation matrix of the fungal community traits was shown with block charts, and metabolites with significant differences were related to each fungal diversity and biomarkers by Mantel tests during fermentation. Edge width means the Mantel’s statistic, and edge color means the statistical significance. *, **, *** represent p < 0.05, 0.01, 0.001, respectively.

