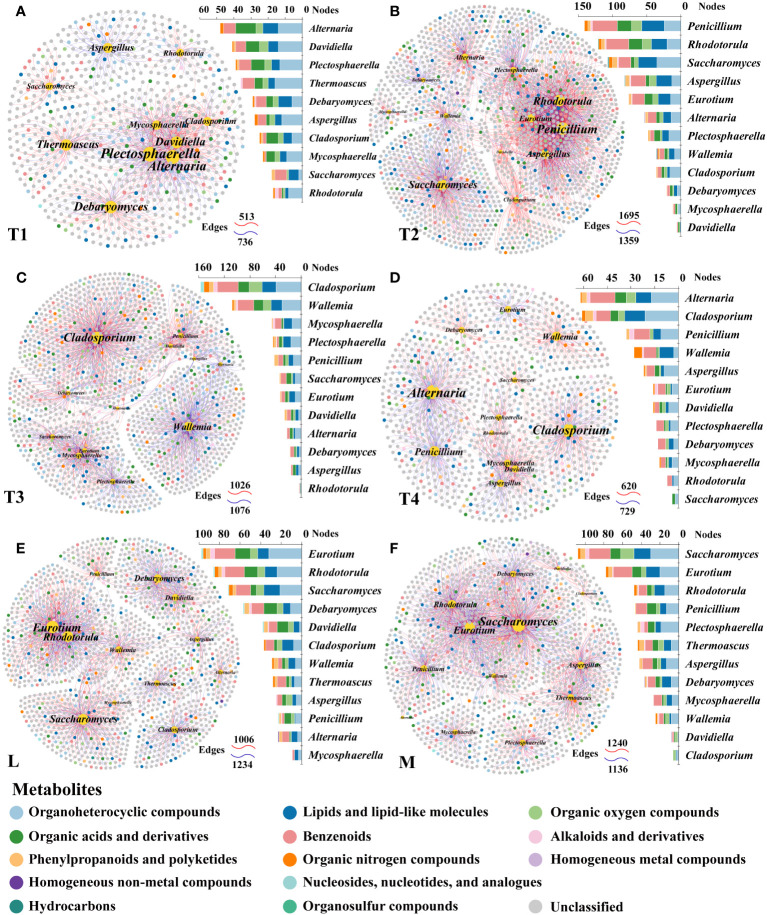
Figure 5.
Correlations between metabolites and associated fungi in plant fermentation processing. Co-occurrence network (left) and the linked nodes number of key genera (right) under T1 (A), T2 (B), T3 (C), T4 (D), L (E), and M (F). In the co-occurrence network, the ginger nodes represent the degree of the OTUs, which belonged to 13 key genera that differentiate fermentation. The remaining nodes represent annotated metabolite ions, marked with different colors corresponding to the superclass level. A connection indicates a strong (Spearman’s |r| >0.7) and significant (p < 0.05) correlation. Positive correlations are shown by the red connections, while negative correlations are shown by the blue links. A node-edge statistics summary was provided, with numbers denoting edges.

